Is The 2022 GSS Sex Data Reliable?
While the more recent General Social Survey sex results haven’t received 1% of the attention as those of 2018 which have probably been shown to Sentinelese tribesmen at this point, in the event that this more recent data is brought up people are generally not happy about it. Everyone’s favourite statistic may have turned out to be not much more than a blip.
Fans of the 2018 data said ‘let’s wait until the next survey before drawing any conclusions’ when the 2021 one came out, but now that we’re here we’re seeing a concerted effort to poke holes in it. I’ve seen multiple times now the criticism levied that the data is worthless because half of young men ‘selected inapplicable’. I even heard someone claim they ‘threw them out’.
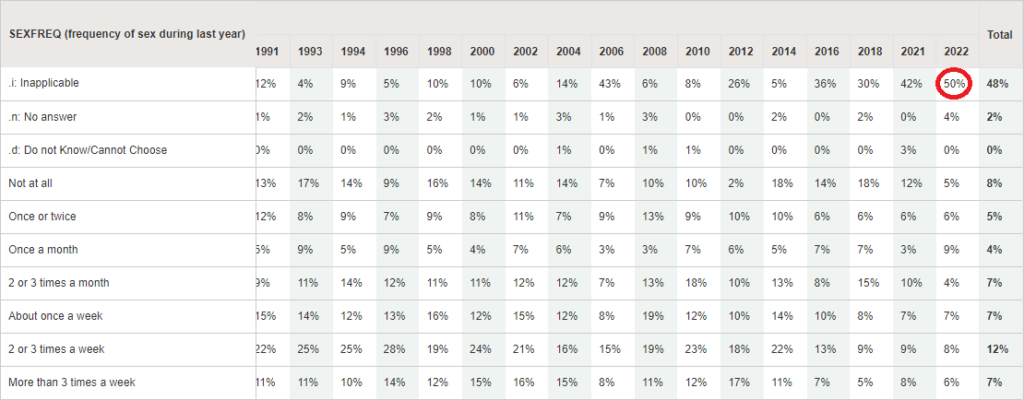
As we see here, it is true that half of the responses to the sexfreq question in 2022 were registered as ‘inapplicable’ (actually close to 54%, this is a weighted percentage). This is up from 30% in 2018 and 42% in 2021. The implication I guess is that a growing number of men are keeping their sexual activity undisclosed because they’re embarrassed or afraid that they’ll be put on an incel terror watchlist. I would think though that if there were a rapidly growing cohort of angry sexless men then they’d want to avoid contributing to the issue being minimized. I could even imagine some men who did have sex saying they didn’t due to how politicized this issue has become.
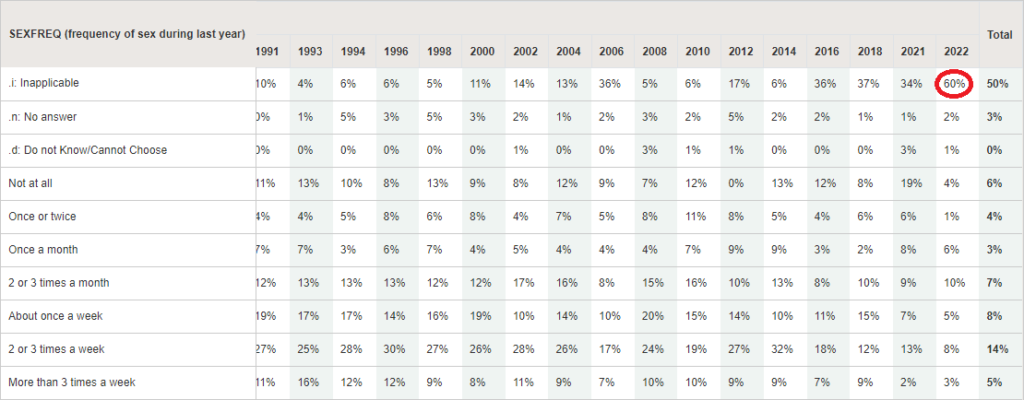
Interestingly, when we look at the female data we see the same thing. 60% apparently selected inapplicable, the highest rate on record. Are they increasingly afraid to admit that they’ve had sex in the past year, or could something else be going on? Why for instance did it abruptly drop from 43/36% in 2006 to 6/5% in 2008, a third of both men and women just randomly decided they felt like answering it all of a sudden?
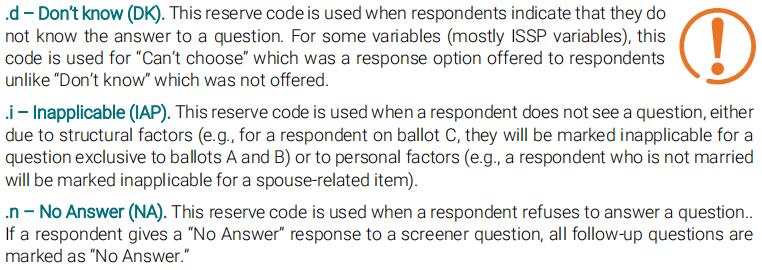
Instead, inapplicable denotes cases in which respondents weren’t administered the question to begin with, for instance if it wasn’t included on the ballot they were issued or if it was a question relating to marital satisfaction while the respondent was unmarried.
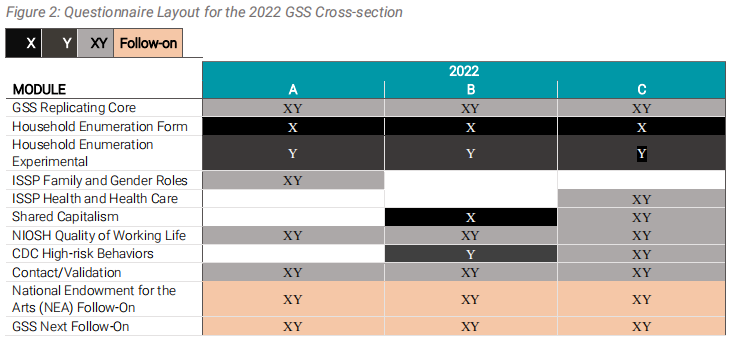
Samples are split into three ballots, which are then split into two forms each to allow for experiments such as testing for the effects of alternative wording. In 2022, the CDC high-risk behaviors module which contained the sex questions was present in only 3 of 6 forms. Mystery solved.
When it comes to non-responses to the survey overall, they are unlikely to be related to sexual behaviour questions as they are among the very last questions and only make up a small portion of the survey. Supplement non-response is also unlikely to be significantly related to those questions as many non-respondents stop taking the survey at the ISSP section. Factors such as low political interest, low cognitive ability, and general uncooperativeness appear to be more related to supplement and item non-response than sexual behaviour is (Smith, 1992).
Another thing which was brought up sometimes in the case of the 2021 survey is that they switched from face-to-face interviews to a web-based survey due to health concerns. The 2022 survey used a multimode design with the sample being divided into one or the other mode. If anything though if social desirability bias had a strong influence we’d expect the online surveys to yield higher sexlessness rates as men would now be more comfortable ‘admitting’ that they were sexually inactive.
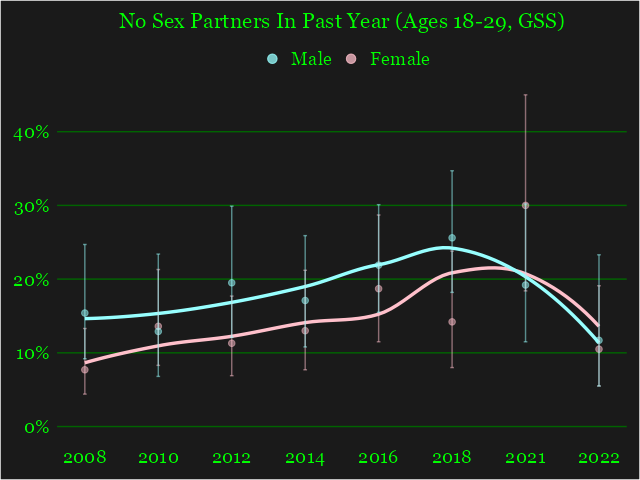
The low sample size of 229 (237 for the partners question) for 18-29s is often criticized (though of course it never came into question when people were making overzealous extrapolations from the 2018 data), but while this is a valid concern, we can still be relatively sure that the sexlessness rate for young men hasn’t shot up to 40-50% or something as many predicted. Here is a graph with error bars. It may look slightly different to the famous one due to using the ‘sex partners in the past year’ question instead of frequency of sex in the past year as in 2012 it excluded people who reported no sex partners in the past year from the question. It also uses a different weight variable and the age range is 18-29 rather than 18-30.
With that aside, the upper bound of the 95% confidence interval is 23.3%, and it’s virtually the same using the sexfreq question. The unweighted percentage was 15.7%, so there’s no fear here of weighting drastically altering the results which seems to have occurred with the political views question.
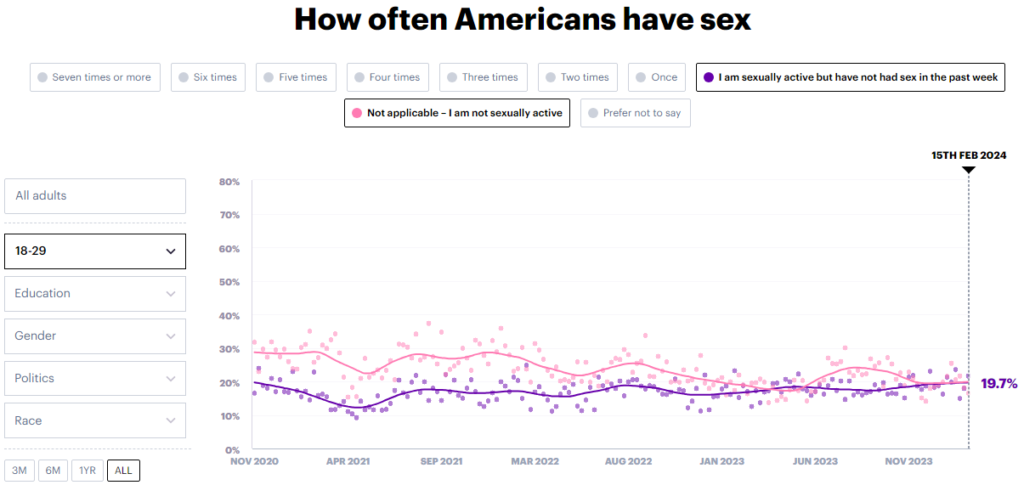
YouGov also shows no sign of a continuing sexlessness trend. As of February 2024, 20% of 18-29s report being sexually inactive down from 30% in late 2020, and the rate reporting being sexually active but not in the past week has remained at a steady 20%. Unfortunately you can’t simultaneously select an age range and a gender, but even if there were a 10% gender gap with more sexually inactive young men, men’s sexual inactivity rate would be 25%.
Another cope is to say that young men are increasingly resorting to visiting escorts. The GSS asks those who reported having sex with someone other than a steady partner if the respondent has paid for or was paid for sex in the past year (we can assume it was generally the former for men), and there’s no indication of this happening.
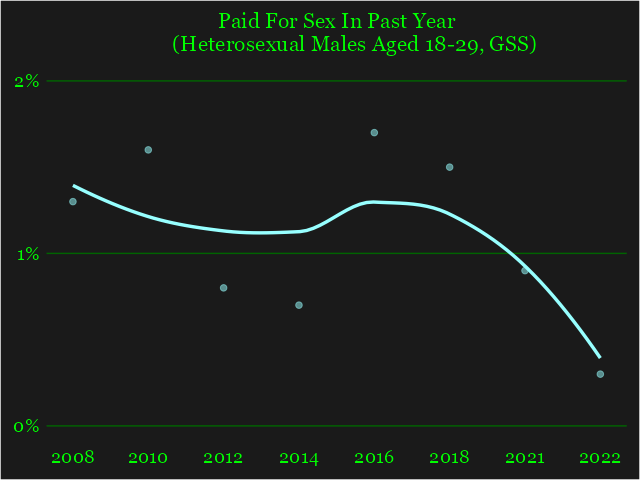
In summary, the data is probably reasonably reliable and it’s unlikely that the young male sexlessness rate is above 25% or that there is a rapidly growing epidemic like the media wants you to believe.
References
Smith, Tom. (1992). A Methodological Analysis of the Sexual Behavior Questions on the GSS. Journal of Official Statistics. 8.

I spent over three hours reading the internet today, and I haven’t come across any more compelling articles than yours. I think it’s more than worth it. I believe that the internet would be much more helpful than it is now if all bloggers and website proprietors produced stuff as excellent as you did.
My brother suggested I might like this website He was totally right This post actually made my day You cannt imagine just how much time I had spent for this information Thanks
Fwiw I think the graphs with a black background and green text aren’t very aesthetically appealing
I was suggested this web site by my cousin Im not sure whether this post is written by him as no one else know such detailed about my trouble You are incredible Thanks
Wow superb blog layout How long have you been blogging for you make blogging look easy The overall look of your site is magnificent as well as the content
I simply could not go away your web site prior to suggesting that I really enjoyed the standard info a person supply on your guests Is going to be back incessantly to investigate crosscheck new posts
My brother suggested I might like this website He was totally right This post actually made my day You cannt imagine just how much time I had spent for this information Thanks
123 슬롯
이 상인은 얼마나 영리한 사람인가, 그는 즉시 깨달은 것을 느꼈습니다.
Наиболее важные новости моды.
Абсолютно все эвенты лучших подуимов.
Модные дома, лейблы, haute couture.
Новое место для модных хайпбистов.
https://worldsfashion.ru/
에그 카지노
Fang Jifan은 다르고 Fang Jifan은 그를 어린 아이처럼 대합니다.
My brother suggested I might like this website He was totally right This post actually made my day You cannt imagine just how much time I had spent for this information Thanks
하바네로 슬롯
고대에 후대 사람들이 본 적이 없는 바다 짐승이 있었다는 것은 놀라운 일입니다.
슬롯 용가리
그가 말한 기세는 마치 무지개 같았다.
메가 슬롯 사이트
Beiwawei의 급여는 좋고 직원을 모집하고 싶다는 소식을 들으면 사람들이 서둘러 첫 번째가됩니다.
Nice blog here Also your site loads up very fast What host are you using Can I get your affiliate link to your host I wish my site loaded up as quickly as yours lol
Ive read several just right stuff here Certainly price bookmarking for revisiting I wonder how a lot effort you place to create this kind of great informative website