Has The ‘Sexlessness Epidemic’ Been Overstated?
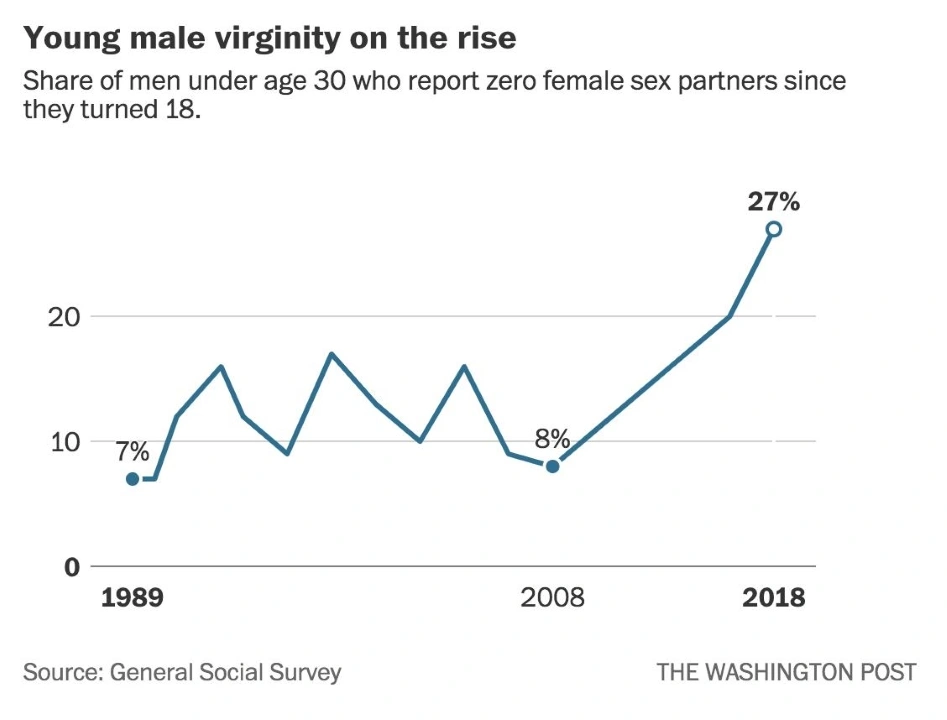
Four years ago, the Washington Post published an article centred on data from the 2018 General Social Survey.
The premise was that there was evidence that we were in the midst of a ‘sex recession’. There had been a decline in the frequency of sex being had, and a stark rise in young people, especially men, reporting no sex in the past year.
This famous graph was produced:
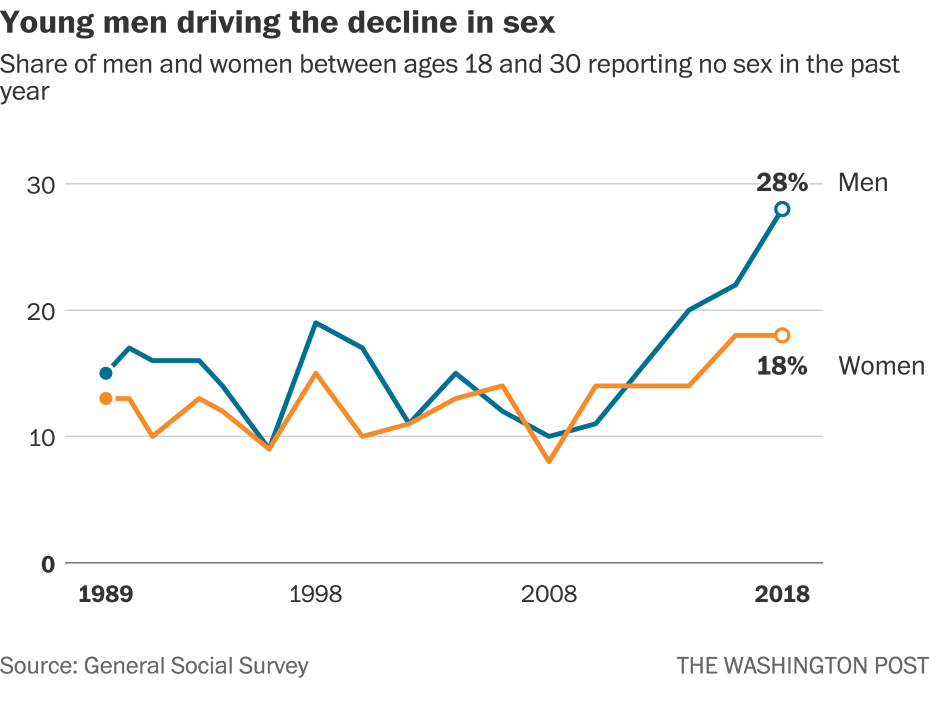
And the internet hasn’t been the same ever since.
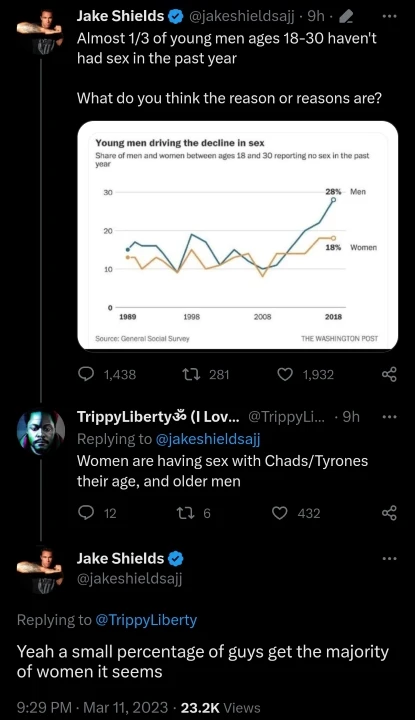
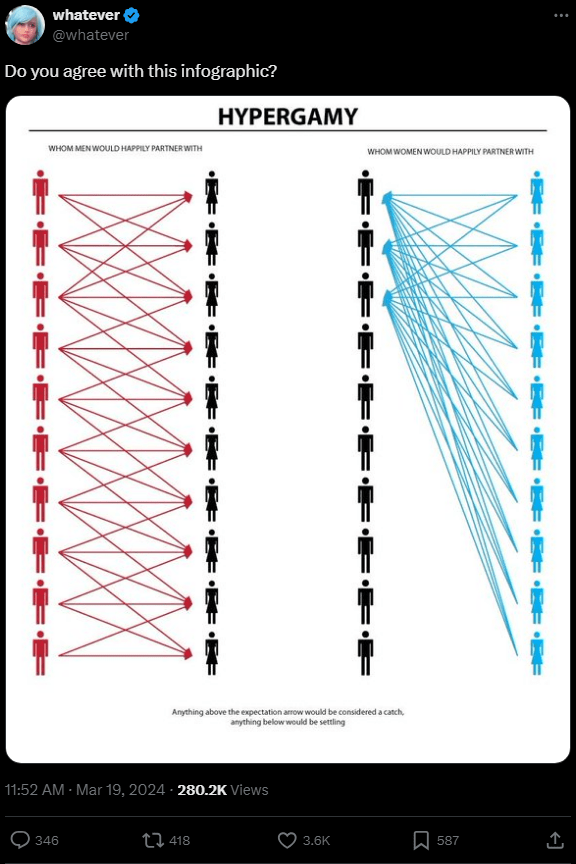
It led to an extensive array of think pieces and YouTube videos opining on the possible causes for this sharp rise in male sexlessness, and it’s of course been heavily utilized by incels and co. in support of the narrative of dating apps leading to sexual inequality between the genders through facilitating female hypergamy.
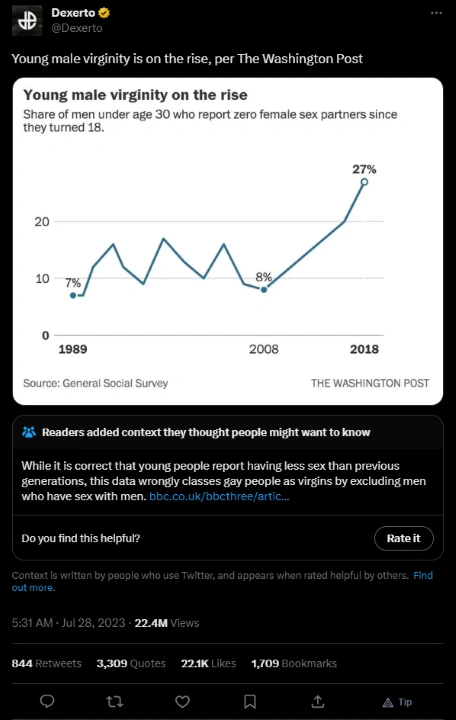
It’s still going strong all these years later:
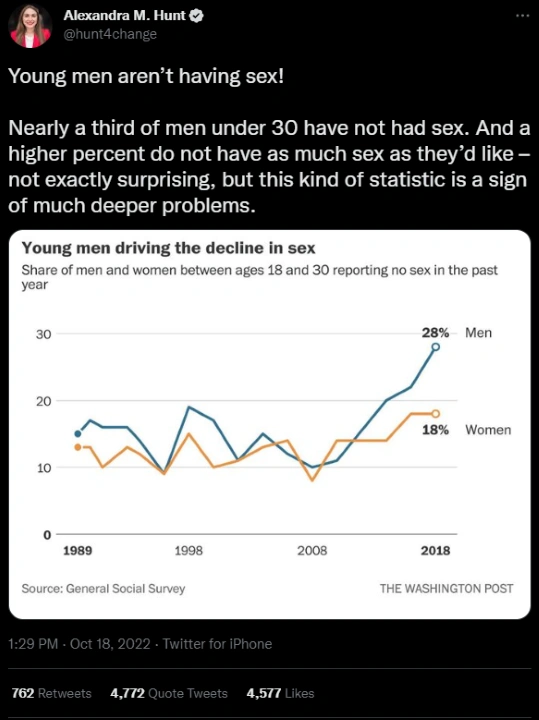
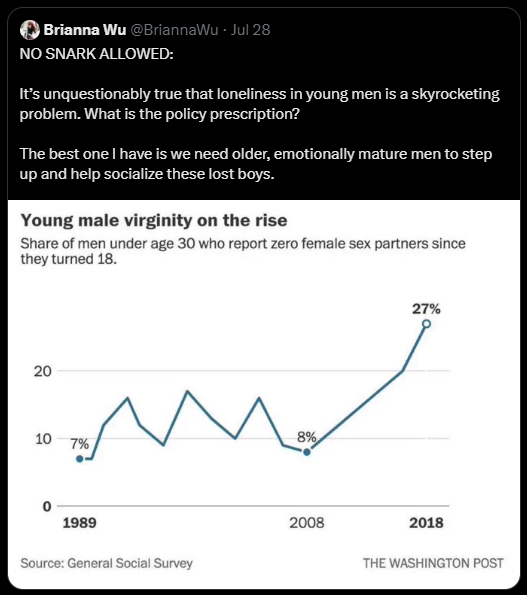
An ex-stripper Democrat politician posted it to twitter to demonstrate the necessity for a ‘right to sex’:
Scott Galloway has been citing it lately in appearances on Bill Maher, CNN, and podcasts, along with the aforementioned narrative that dating apps are responsible.
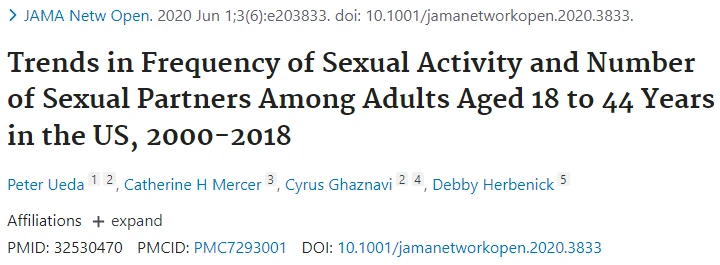
The same dataset was the basis for this widely cited paper:
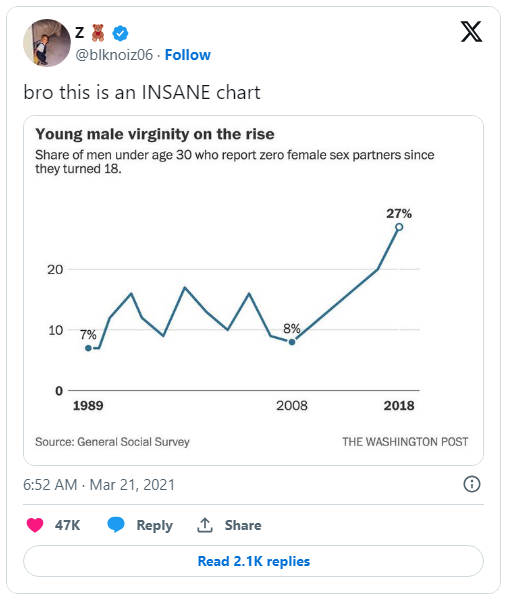
There was also another graph purporting to show male virginity skyrocketing which the author posted to Twitter:
Which is still circulating heavily to this day, and is a guaranteed viral tweet any time it’s posted by a large account on Twitter:
Even prominent feminists have gotten in on the action:
It’s probably not a stretch to say that these are the most famous graphs in history. Given this, and given that it’s by far the most common reference point when it comes to the ‘sexlessness’ discourse, surely the data must be highly reliable, right?
- More Recent Survey Data
- What Happened?
- The NSFG
- The Virginity Graph
- Volcels
- Other Countries
- Common Criticisms
- The Femcel Question
- What Is The Big Appeal?
- Conclusion
More Recent Survey Data
The first thing we should check is whether this supposed trend continued in the following surveys. It’s not as if the GSS suddenly went defunct in 2018. Although there was a slight delay for obvious reasons, there was another survey conducted in 2021, and then another in 2022.
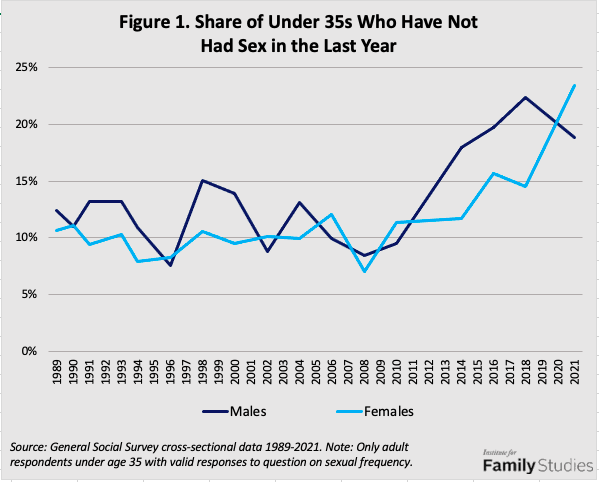
The Institute for Family Studies created these graphs following the release of each dataset. The first had an age range of 18-34, the second 18-29.
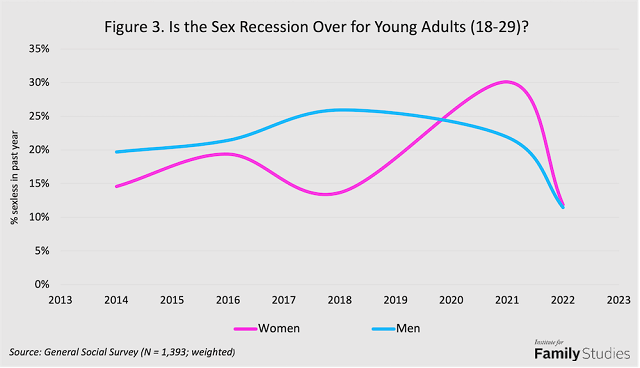
Wouldn’t you know it, in the very next survey the sexlessness rate for men declined while the rate for women actually shot up and surpassed men’s – some speculate due to covid and women acting more risk averse.
There was then apparently a post-covid sex boom in 2022, with women’s sexlessness rate plummeting, and men’s continuing to decline, meeting together at about 12%.
Of course since these results didn’t suit the alarmist narrative, they were met with radio silence.
What Happened?
So what are we to make of this strange turn of events? Is the sex recession over already? Was it ever even real to begin with?
You’ll notice that there are no error bars on these graphs that would allow us to gauge the level of uncertainty in the measurements. We can only look at the previous years to get an idea of how much it tends to fluctuate. We do see some relatively steep ups and downs, but nonetheless never reaching the peaks observed in 2016 and 2018.
Is it possible that the sample size was markedly lower than usual? These are the unweighted sample sizes for 18-30 men:
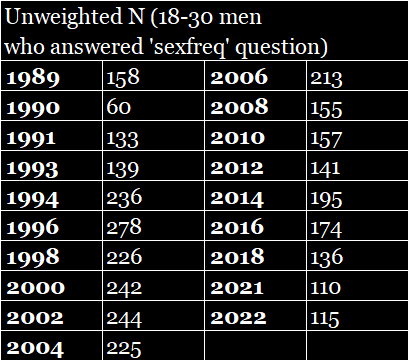
We find that not only are the sample sizes in general nothing to write home about, the sample size in 2018 was the lowest since the early 90s, and since 2008 it had been cut back a fair amount from the surveys conducted between 1994-2006, leaving more room for variance in this time period.
It does look like a fairly linear trend, but this changes somewhat when you instead use the variable ‘partners’, which asks how many sex partners respondents had had in the past year. The rates between the questions are usually very close, but vary a bit probably due to slightly differing respondents and maybe interpretations of the questions.
There’s also however the fact that the 2012 data point is missing from the WaPo graph since for some reason the rate reporting 0 in that year was very anomalously low for the ‘sexfreq’ question.
This is what a graph using the ‘partners’ variable (and limited to heterosexuals) looks like:
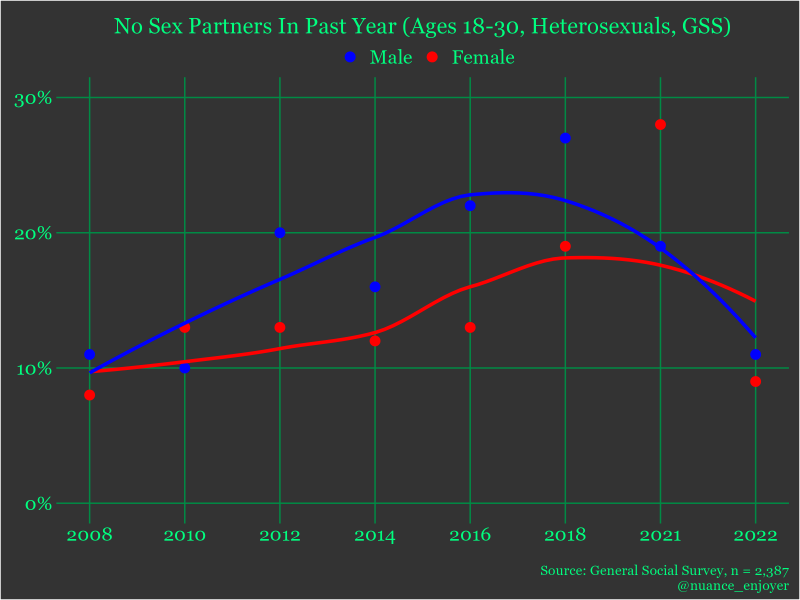
Less of a clean linear trend. Still, we probably shouldn’t expect so much variance, even with a sample size as low as 115-136 for men in the cases of 2022 and 2018.
Let’s say we randomly sample 100 people and get an estimated proportion of 20%, we can be 95% confident that the true population parameter falls within the range of 12% to 28%. However, if we run 100 trials, most values will be relatively concentrated near the centre, with only a few nearing or passing the outer edges. Moreover, the CIs will be a bit narrower for our samples a bit over 100.
It’s worth considering that the GSS employed cluster sampling prior to 2021, which tends to lead to more variance, but probably not enough to reasonably explain the fluctuations here. Using Berkeley’s SDA tool, which computes CIs while taking the complex sample design into account, we find an error range of 20.2% to 36.6% for a weighted proportion of 27.6% for 18-30 men reporting no sex in the past year.
There’s also the fact that they shifted to web-based surveys for the COVID affected year, then went half and half for 2022. The drop would seem to go against the typical assumption of social desirability bias leading men to lie up about their sexual experience however as you’d expect it to have more effect in the less anonymous in-person interviews, and if this was the cause we’d presumably expect the 2022 rate to be somewhere between the 2018 and 2021 rates.
Maybe the key lies in the weighting process. Here is what the unweighted percentages look like:
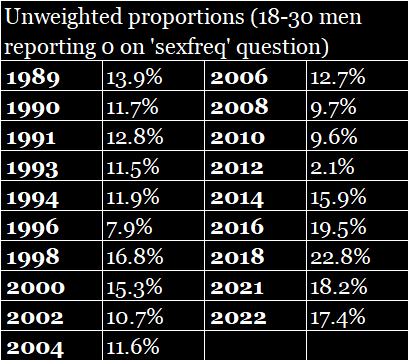
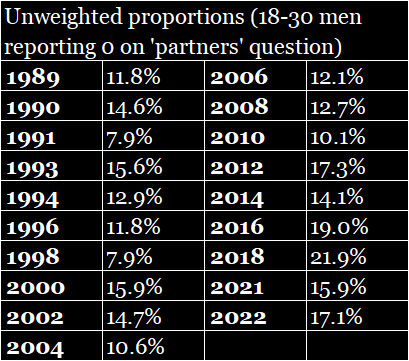
While on average weighting the data tends to increase the rate by a bit over 1%, in 2018 this was close to 5% for the ‘sexfreq’ variable, and close to 6% for the ‘partners’ variable. Conversely, the unweighted rate in 2022 was some 5% higher than the weighted rate. While the gap between the lowest and highest rates in the weighted data is over 15%, the largest gap here is 6.9%.
How do we explain this discrepancy? Date Psychology in this excellent article on the virginity graph brings up an important point regarding the age distribution. If for example we look at the unweighted sample size of 18-20 men who answered the ‘sexfreq’ question in 2018, it was just 20, while for 28-30 men it was 36. There definitely are not 80% more 28-30 men than 18-20 men however. The percentage of 18-20 men reporting no sex in the past year was 50%, up from 28% in 2016. Most of this spike is without doubt a result of noise due to random error, and it will also be weighted up due to a relative underrepresentation of younger respondents, inflating the overall rate.
So maybe we got an exaggerated picture of the trend, but is there still something there at least? It remains true that the highest rates on record have been in recent years, and if we looked at a rolling average we’d still see some kind of trend, so it’s still likely that there’s been an uptick. It’s highly unlikely however that the rate has nearly tripled over the span of 2008-2018.
So what’s another way we can determine whether there’s been a sex recession and if so to what extent? We hear endlessly about the GSS data, but is NORC really the only organization that collects data on sexual activity?
The NSFG
Another nationally representative US survey, conducted by a subdivision of the CDC, is called the National Survey of Family Growth. What’s appealing about this survey is that it boasts a much more respectable sample size. For 18-30 men, the sample size was 2,034 in the 2017-2019 survey cycle (essentially comparable to 2018), compared to the meagre 136 we found in the GSS, so about 15x as large. Needless to say this allows for much less room for error.
Here is a graph showing the proportion of heterosexual men and women aged 18-30 who reported having no opposite-sex sex partners in the past year:
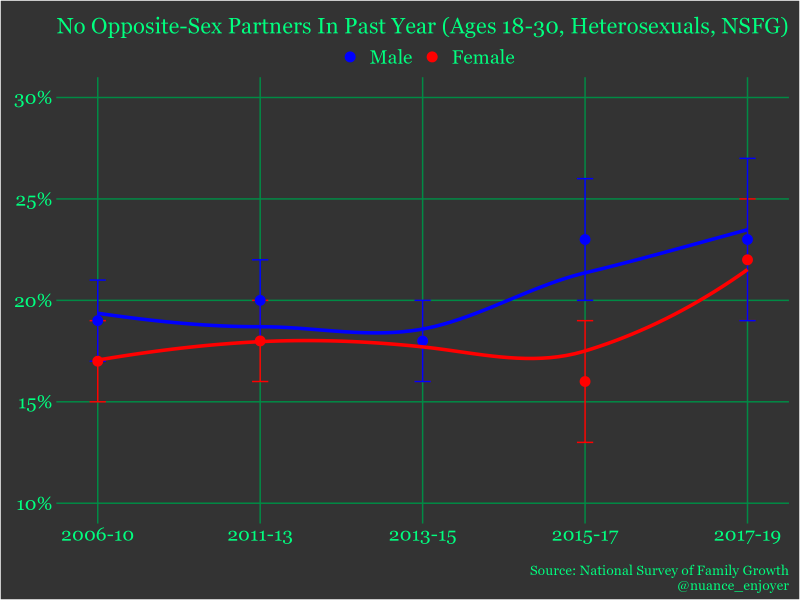
What we find is a much more modest rise, from about 19% in 2006-10 to 22.5% in 2017-19 for men, and 17% to 22% for women, so about 20-30% proportional increases over this time span.
It seems like the GSS data probably led to an exaggerated picture as the inferred trend both began at a point which was likely an underestimate in 2008, and then ended at a point which was likely an overestimate in 2018.
I conducted some one-tailed Z-tests to determine that there was indeed a significant difference between the rate in 2013-15 and in the later years for men, and between the earlier years and 2017-19 for women.
There’s little indication here of a significant gender effect here either, with the exception of 2015-17. There’s likely a small gender gap though even if only for the fact that there is a slight male surplus in these age groups. Women also tend to date slightly up in age. Of course some age groups are more sexually active than others, and these trends may have also affected them to varying degrees. Here’s what the results look like for more specific age groups:
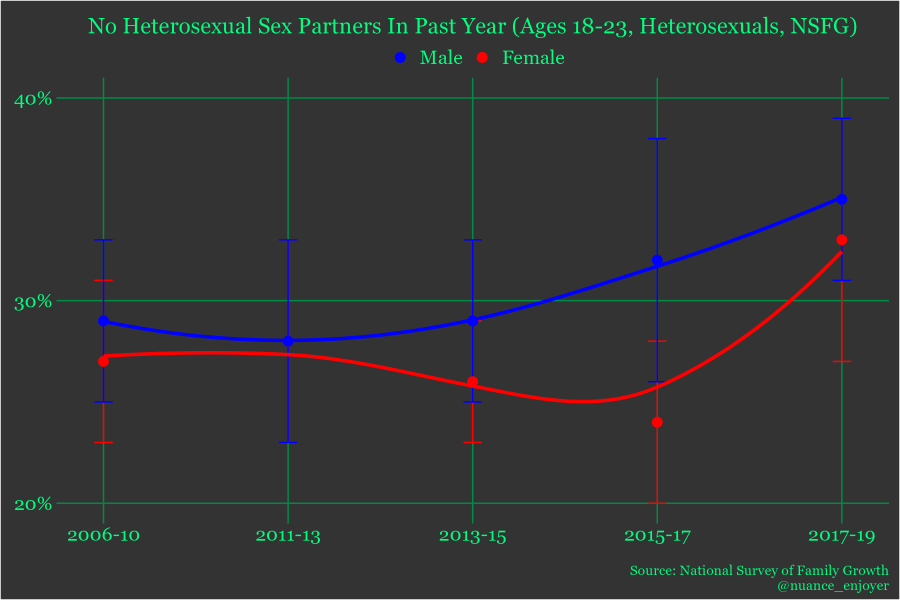
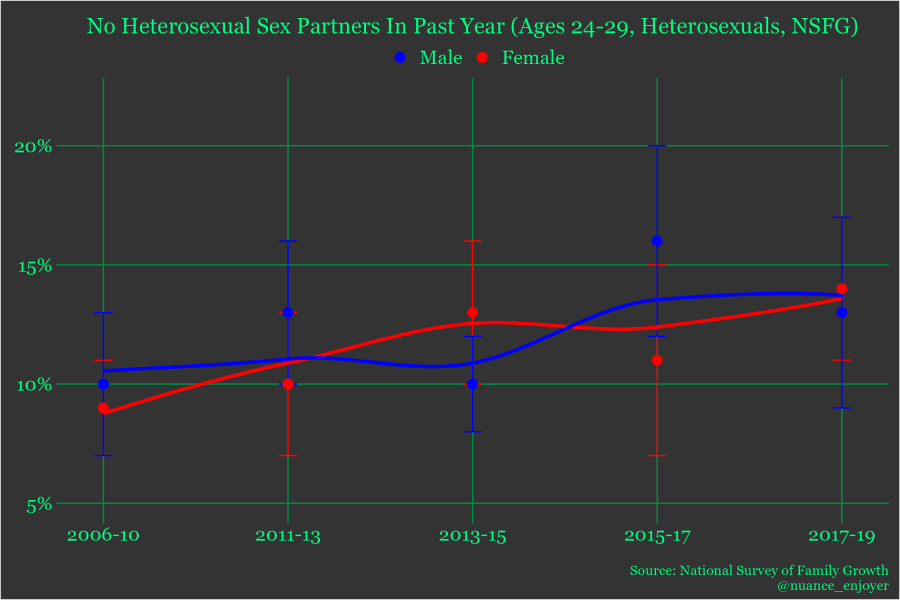
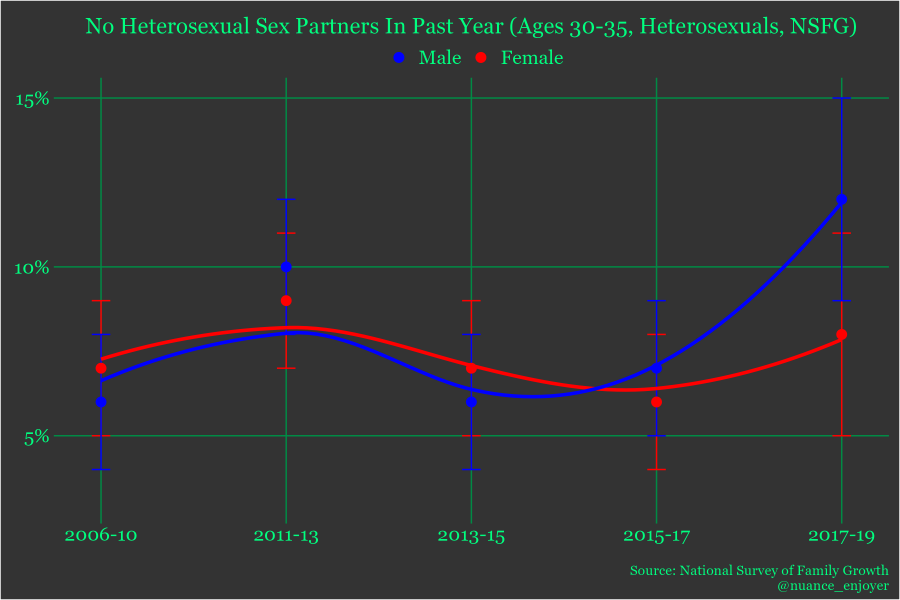
There is a fairly consistent upward trend, least obvious in the case of the 30-35 cohort although there was a spike at the end for men, but again the changes clearly aren’t as mind blowing as we’ve been led to believe, and there doesn’t seem to be good evidence for it being gendered either.
The Virginity Graph
It’s time to return to the second WaPo graph. Since we’ve established that the 2018 male sexlessness in the past year data point was probably an overestimate, the same is obviously going to apply to the ‘virginity’ one.
There are a few additional issues with this graph though. Ever since I first saw it, I found it peculiar that the percentage was only a single percentage point lower than the one shown in the past year graph. This would have to mean that close to 99% of the men who’d had sex before also had it in the past year. To be fair, it’s easy to miss, but the age range is slightly younger for this graph (under 30s instead of 18-30), but this only seems to have affected the rate by 0.1%.
The first is that you will notice that the question specifies ‘female sex partners’. Despite this fact, they failed to limit the subsample to heterosexuals. This is a pretty big oversight as the vast majority of homosexual men hadn’t had a female sex partner according to the same dataset. Sexual orientation was only asked about beginning in 2008 however, which may be why it was ignored.
Another issue lies in the fact that it asks about sex partners the respondent has had since turning 18 (including in the past year). There will be some respondents however who have had sex before turning 18 but not since (or in the past year), especially ones on the younger side (causing further inflation during to the weighting process). For instance, if a respondent was 18 and 1/2, a sex partner encountered when they were 17 and 1/4 wouldn’t be counted. Any sex partners encountered before 17 wouldn’t be counted, period.
Another question is asked, which is: ‘how many sex partners have you had in the past five years?’. This is obviously an imperfect proxy as well, but nonetheless it gets around the first issue (if you don’t feel like filtering by sexual orientation), and also may give more accurate estimates if there are more men who had had a sex partner before turning 18 but not since than there are who have had a sex partner before five years ago but not since, which seems to be the case at least for this age group.
The 2018 rate drops from 26.7% in 2018 to 23.1% when instead using the ‘partnrs5’ variable. In 2021 it was being inflated more still, as it drops from 21.9% to 14.4%. Then in 2022 curiously it was slightly higher than those who reported not having had sex in the past year, at 12.8%. So in the past two surveys, the sacred 2018 number was literally cut in half.
We can also turn to the NSFG to see if it corroborates these more modest virginity estimates.
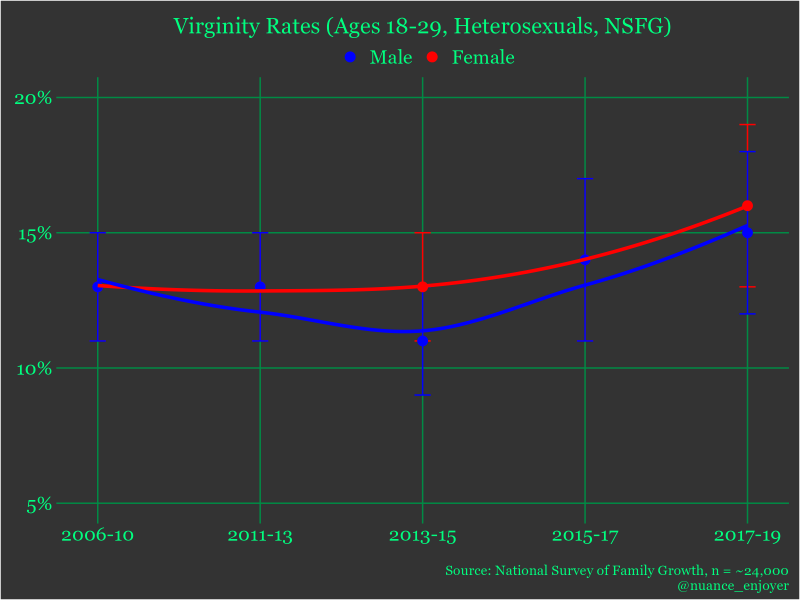
The answer is yes. The rate in 2017-19 for heterosexual 18-29 men was 15.2%. Again, the sample size here is substantial, so we would be very surprised if the true rate were in fact above 18%.
Here are the 2017-19 results broken down into individual ages:
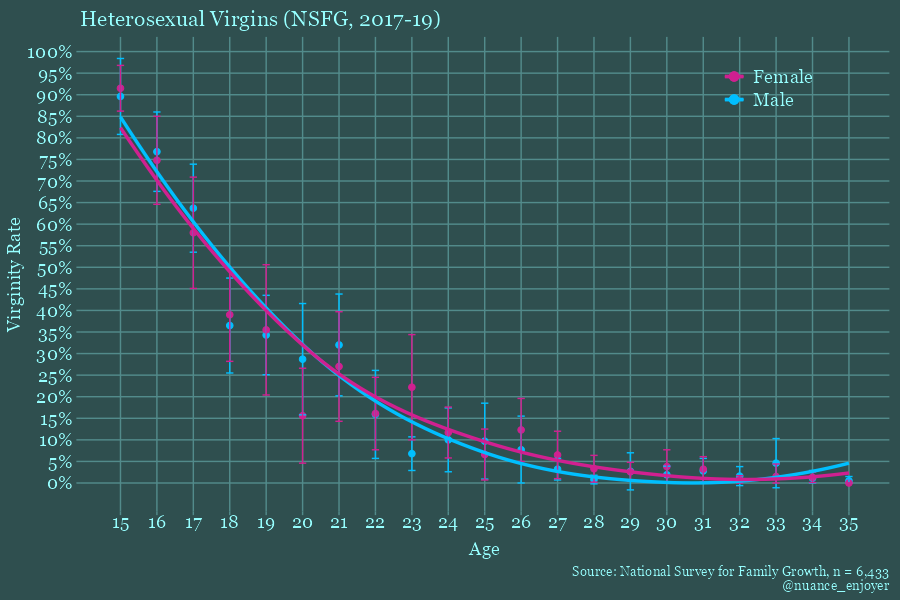
If you’re between the ages of 18-20, then 1 in 3 does indeed apply.
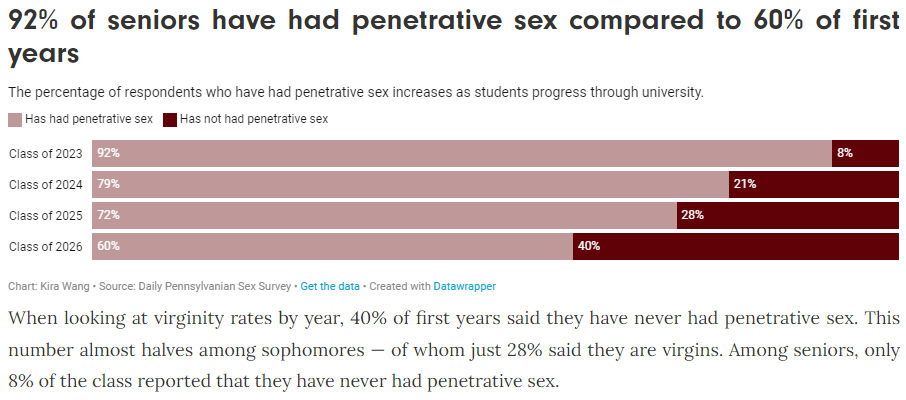
A recent survey of Penn state undergrads also found an averaged rate of about 30% for 18-20s so it probably hasn’t changed much since this survey:
If you’re in your mid to late 20s however, you’re going to have to cope with the fact that this is when it falls from 10ish to 1-2%.
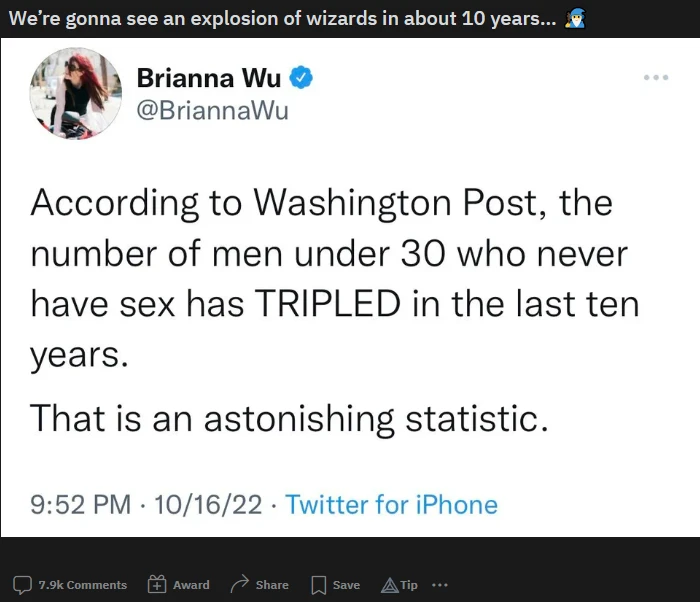
People have predicted from the GSS data an ‘explosion of wizards’, or 30 year old virgins:
It could easily be the case that the age is simply being pushed forward, perhaps back to the boomer average. If it were actually skyrocketing as much as much as the GSS graph implied we might need to bring in additional explanations, but the more reliable data is definitely consistent with the phenomenon of ‘extended adolescence’ and ‘risk aversion’ outlined in Date Psychology’s article. Young people are hitting milestones later in life. They’re taking less risks, socializing less, moving out later, and so on.
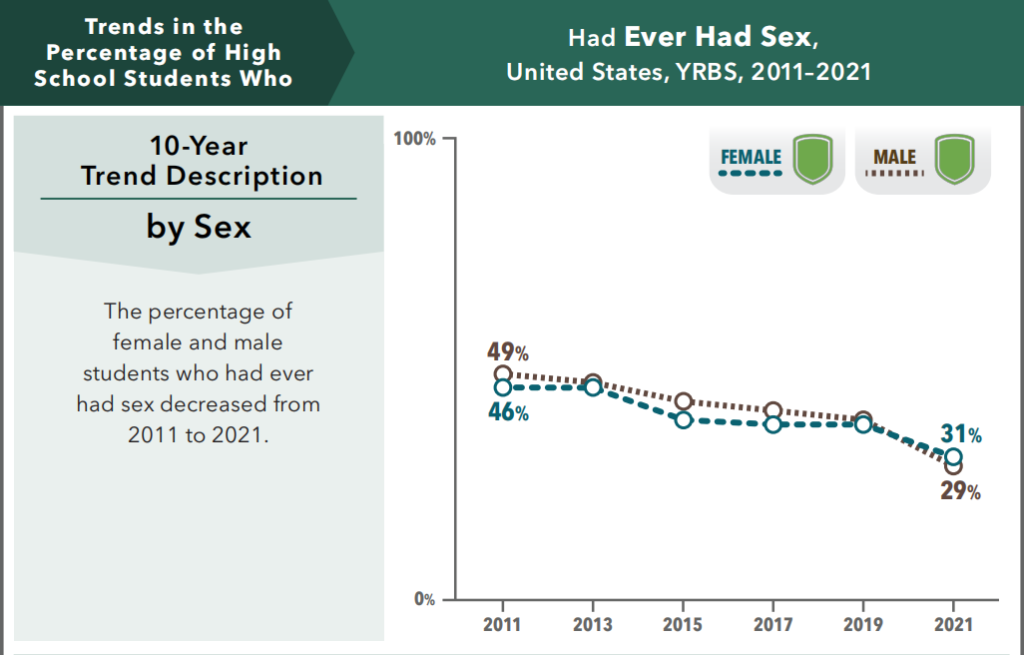
The CDC conducts another survey named the ‘Youth Risk Behavior Survey’. It found a reduction in sexual activity among high school students. Of course it may have been amplified in 2021. We also don’t see evidence for a significant gender effect.
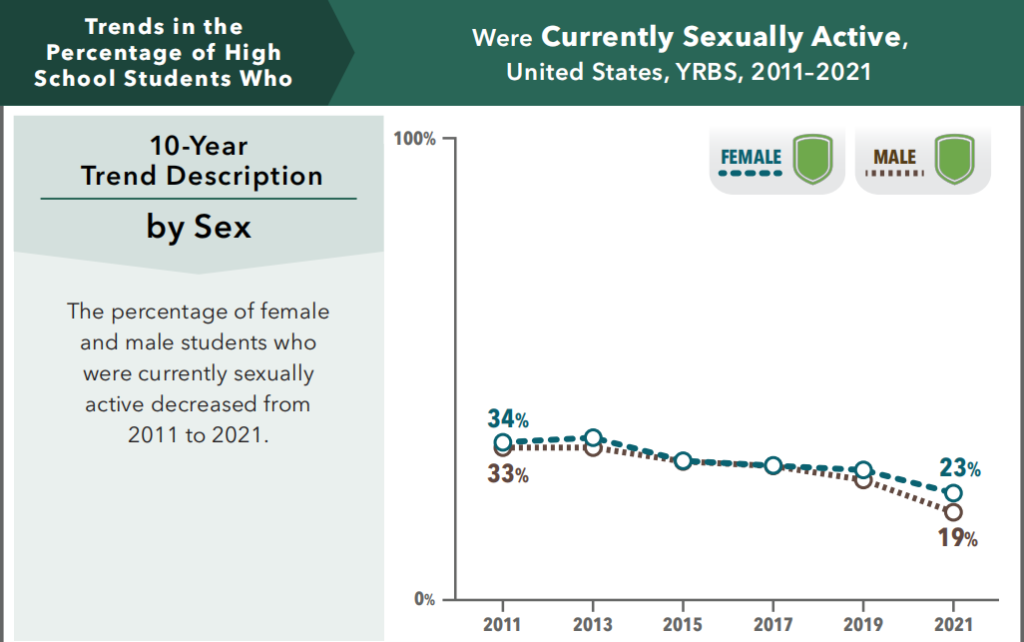
As well as a sharp decrease in alcohol consumption and other ‘risk behaviours’ (risking having a good time am I right):
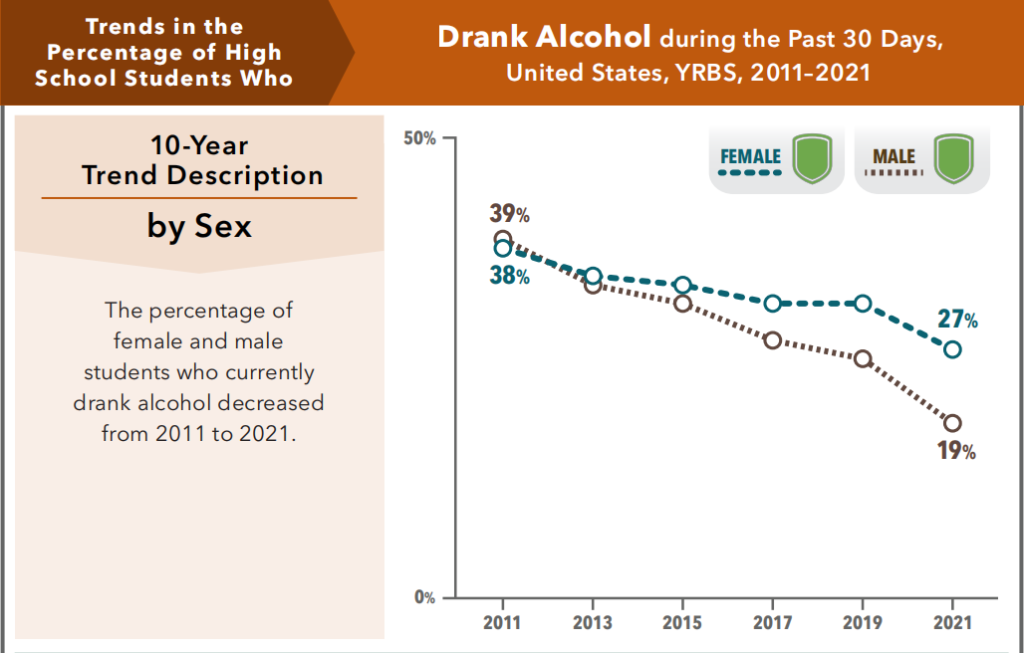
The relationship between alcohol and sex is of course well known.
It’s to be seen if there’s a substantial portion of these man(and woman)children who never grow up and become permanently sexless.
Volcels
It’s often assumed that the men represented in these graphs are all involuntarily sexless, as they will be referred to broadly as ‘incels’, or ‘the bottom 30%’, as there exists the presupposition of a simplistic hierarchy wherein the most attractive men have the most sex and vice versa.
Do we have good reason to believe this though?
Well we may have good reason to believe otherwise. The IFS also produced this graph showing rates of sexlessness in the past year among never married under-35s by their views on premarital sex:
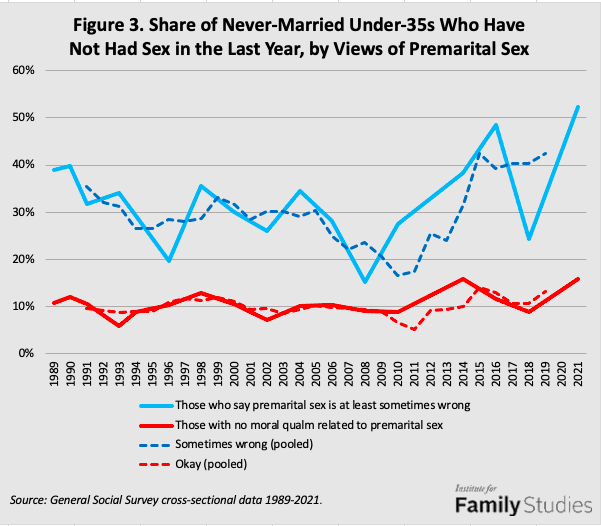
We see that among those who profess moral qualms with premarital sex (at least sometimes), their sexlessness rates are much higher. For the record I checked and this did apply equally to both genders.
Since most unmarried men without these principles were not sexless, it follows that the men with them likely wouldn’t be either if they decided to drop them. I doubt that this is just because they’re less attractive than those ‘degenerates’ who engage in it, or that they just adopted these beliefs as a ‘cope’.
Of course if it’s getting harder to find a suitable marriage partner then that’s its own issue.
The NSFG actually asks directly why respondents remained virgins. These are the rates for 18-29 men who reported either not having ‘found the right person yet’, or ‘other’:
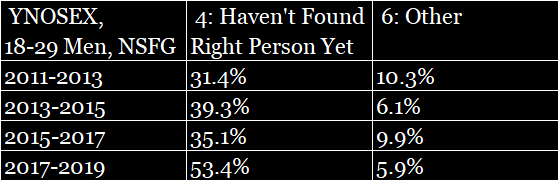
The other reasons listed were ‘against religion or morals’, ‘pregnancy risk’, ‘STD risk’, ‘in relationship waiting for the right time’.
We can assume ‘haven’t found the right person yet’ represents an ‘involuntary’ reason, since they had the option of stating it was for religious or moral reasons. We can be charitable and assume that a good portion of those who selected ‘other’ also had a reason unrelated to personal choice.
This still leaves a good half or so who reported reasons which can be interpreted as voluntary. If we were to then apply this to the 15% virginity rate, we’d be now looking at a remaining 7.5% or so who were actually involuntarily virgins.
Pertinent to the incel narrative of physically inadequate men being relegated to incel status, the GSS also measured height and physical attractiveness on that fateful survey year of 2018.
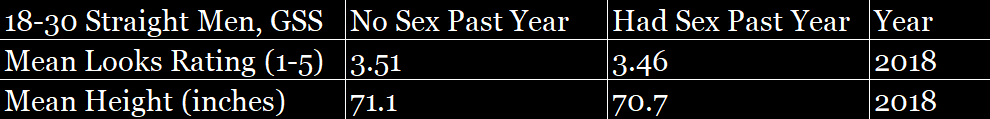
Of course the sample size isn’t nearly enough for these small differences to be statistically significant (or to rule out a decent difference in the other direction), but if we are to take the results of it as gospel truth like everyone did for the sexlessness rates, we’d have to conclude that if anything sexless men were slightly more attractive and tall than sexually active men.
Other Countries
All of the data so far has been US based. As much as some Americans may believe otherwise however, it is not the only country on the planet. Unless there is something uniquely American about these social trends, we should expect to see them occurring in other parts of the world too.
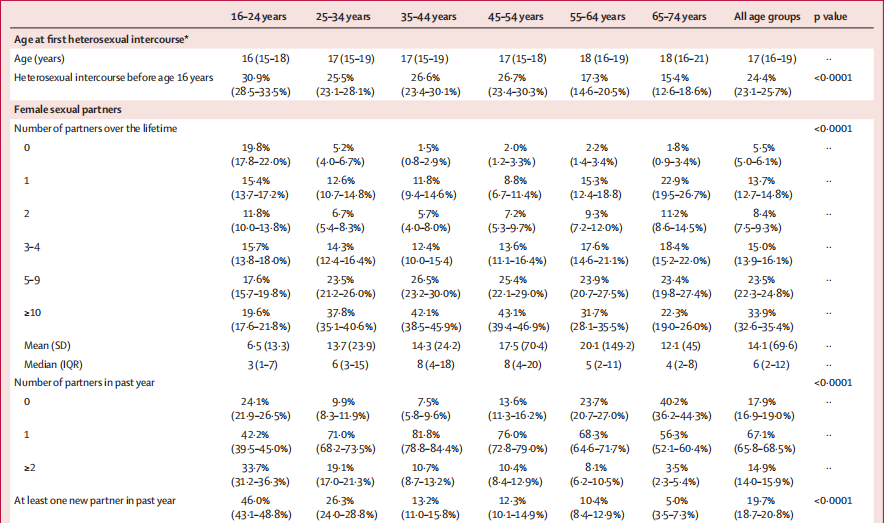
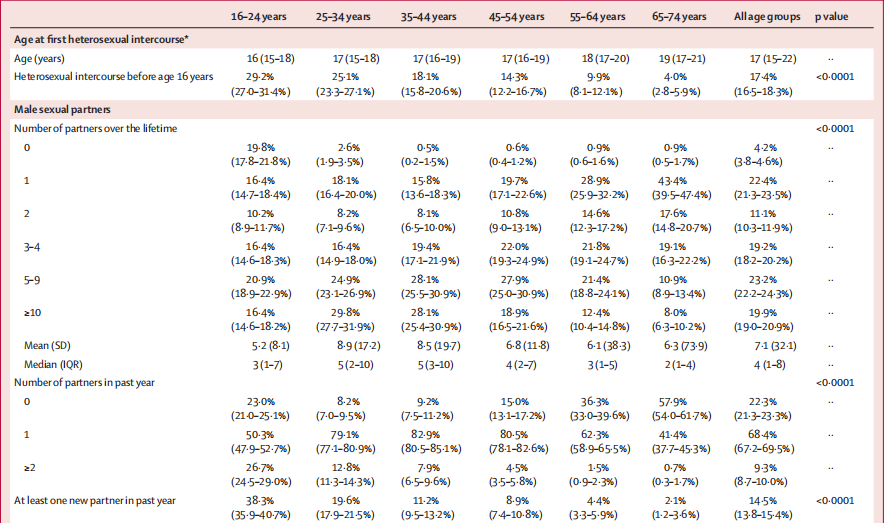
Let’s start with data from a large nationally representative British survey, The British National Surveys of Sexual Attitudes and Lifestyles.
In Natsal-3, carried out between 2010 and 2012, it found that 19.8% of 16-24 men and 5.2% of 25-34 men were virgins. The figures were 19.8% and 2.6% for women, respectively.
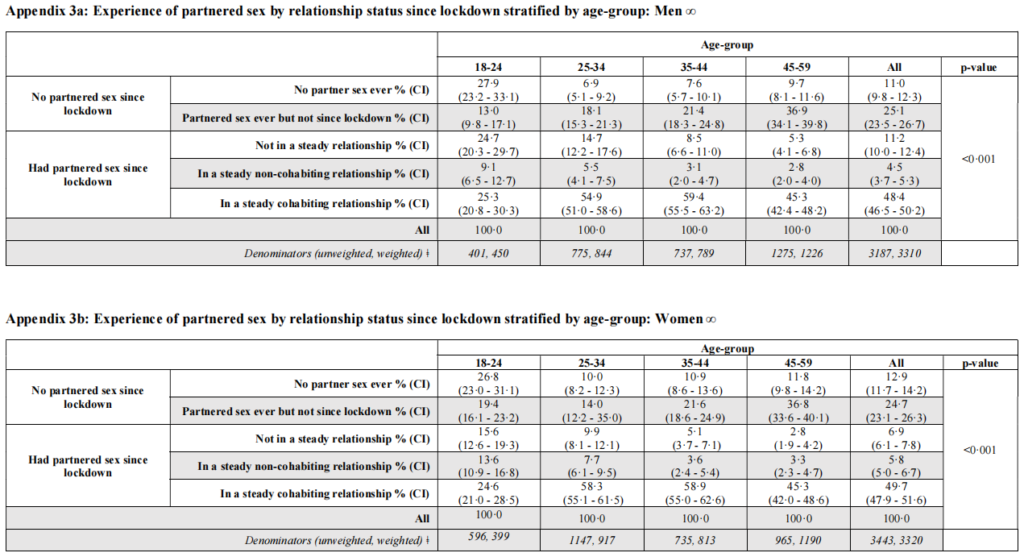
Another survey was conducted during COVID.
It was found that of 18-24 men, so a slightly older lower age bound, 27.9% had never had ‘partner sex’, while 13% had had it before but not since lockdown, which at that point was 4 months ago.
These figures were 6.9% and 18.1% for 25-34 men. The figures were 26.8% and 19.4% for 18-24 women, and 10% and 14% for 25-34 women.
In terms of the virginity rate, which I’m assuming we can infer from ‘partnered sex’, despite having a higher minimum age, it rose by about 35-40% since natsal-3.
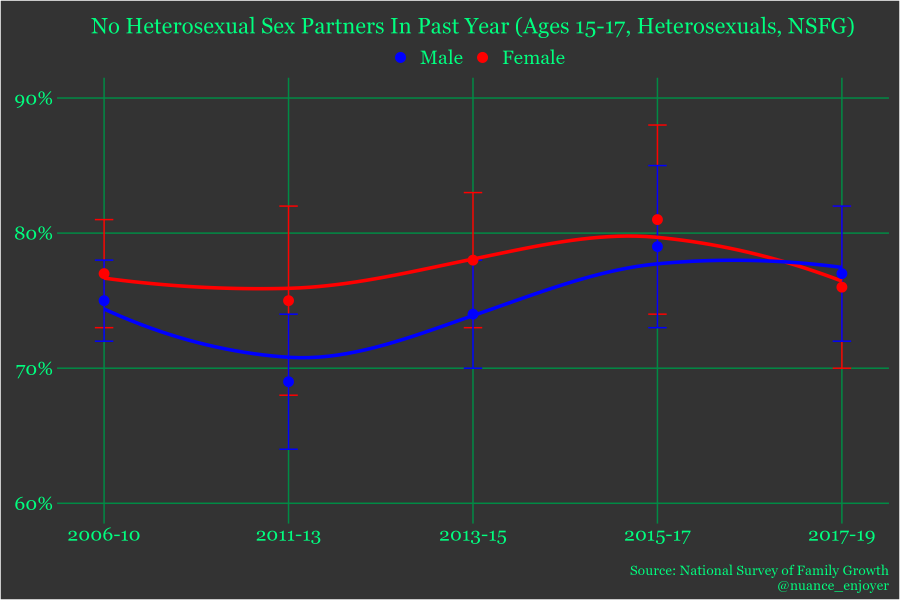
The virginity rates for 18-24 heterosexual men and women rose from about 18% and 20% to about 24% from 2011-13 to 2017-19, so a similar trend.
When it came to 25-34s on the other hand, the female rate rose a lot more, especially proportionally to the Natsal-3 rates. The rates were also suspiciously high for older participants and inconsistent with the Natsal-3 results, so maybe the question was worded differently or something.
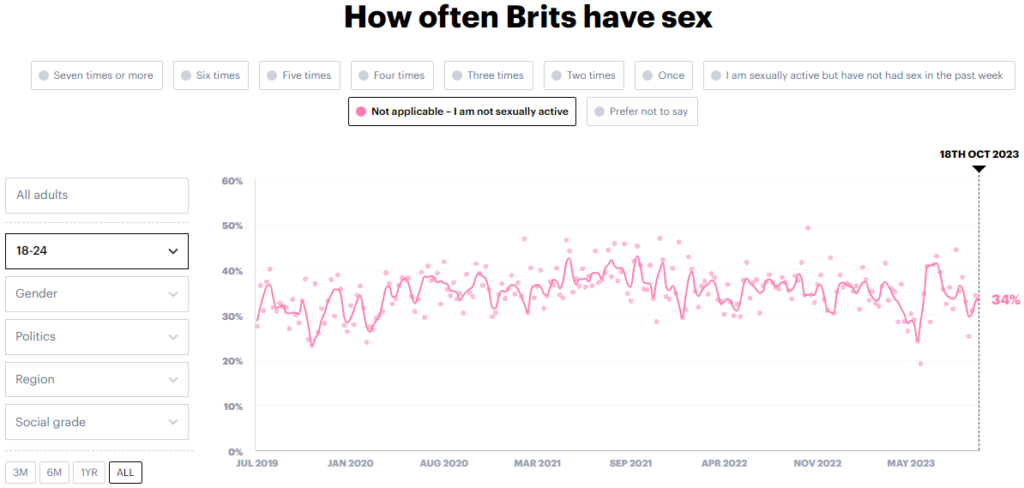
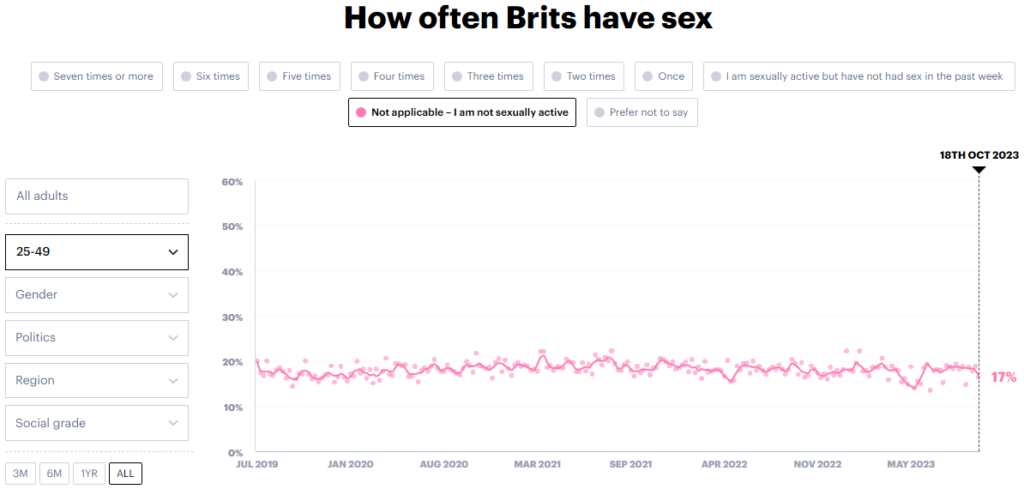
These following surveys were conducted by the company ‘YouGov’, with about 1,000 respondents per weekly wave for Britain and 2,000 for the US.
We don’t see any evidence for a continuing reduction in sexual activity among Brits aged 18-24 or 25-49 from July 2019 to now. It looks like it may have been dropping somewhat as COVID restrictions were implemented, but has since returned back to where it was.
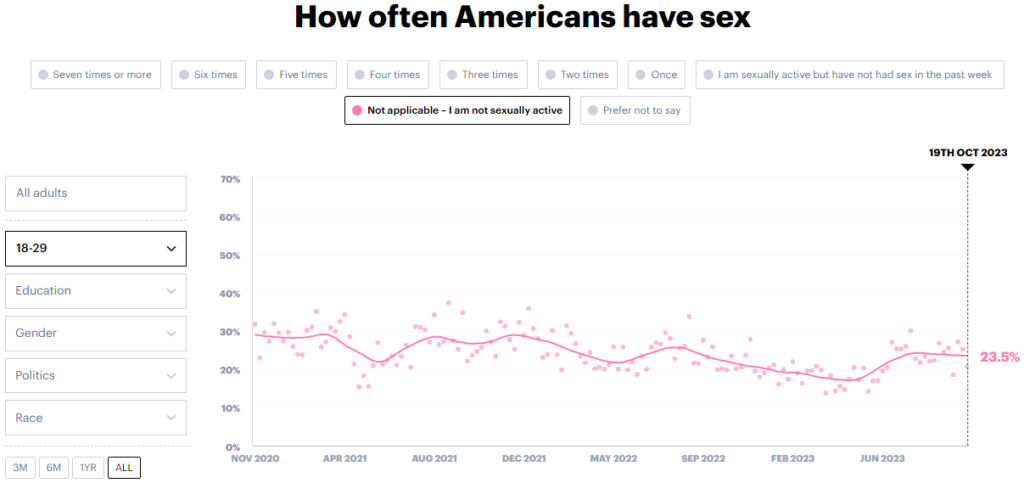
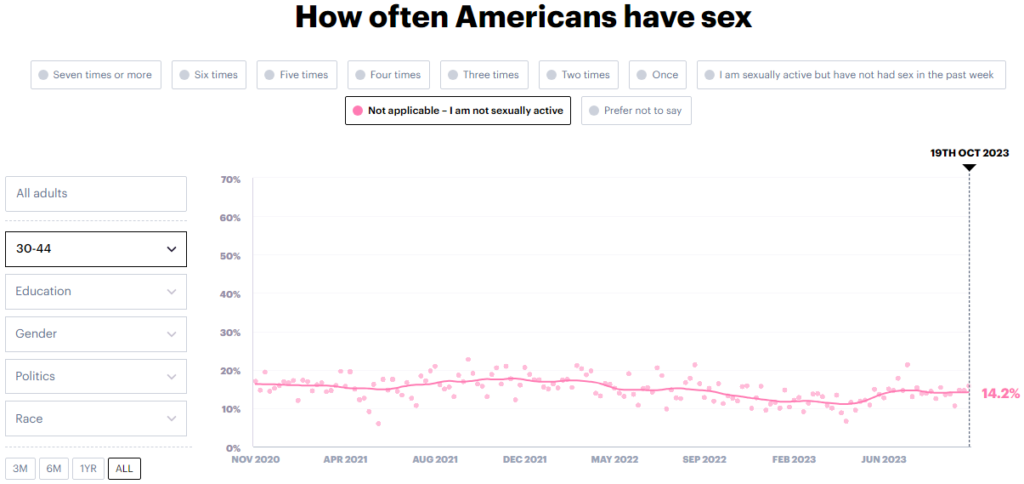
I said we were moving on from America, but just for good measure, if anything we see an increase in the amount reporting being sexually active from November 2020 to now. The most recent data has 23.5% of 18-29 Americans reporting not being sexually active, and some people presumably had sex in the past year but weren’t currently sexually active.
It’s of course possible that the apparent reversal of the ‘sex recession’ is actually a reversal of the COVID effect as society begins to open up more and people begin mingling again.
Nonetheless these results make it unlikely that the sex recession is in full force. Unfortunately you can’t select both an age bracket and gender simultaneously. Significantly more men reported being sexually active overall, but this will be skewed by the older cohort.
From surveys of 12,400 Italian university students in 2000 and 2017, there was actually a reduction in the virginity rates of men and women, from 30.2% to 18.8% and 35.6% to 21.1% respectively.
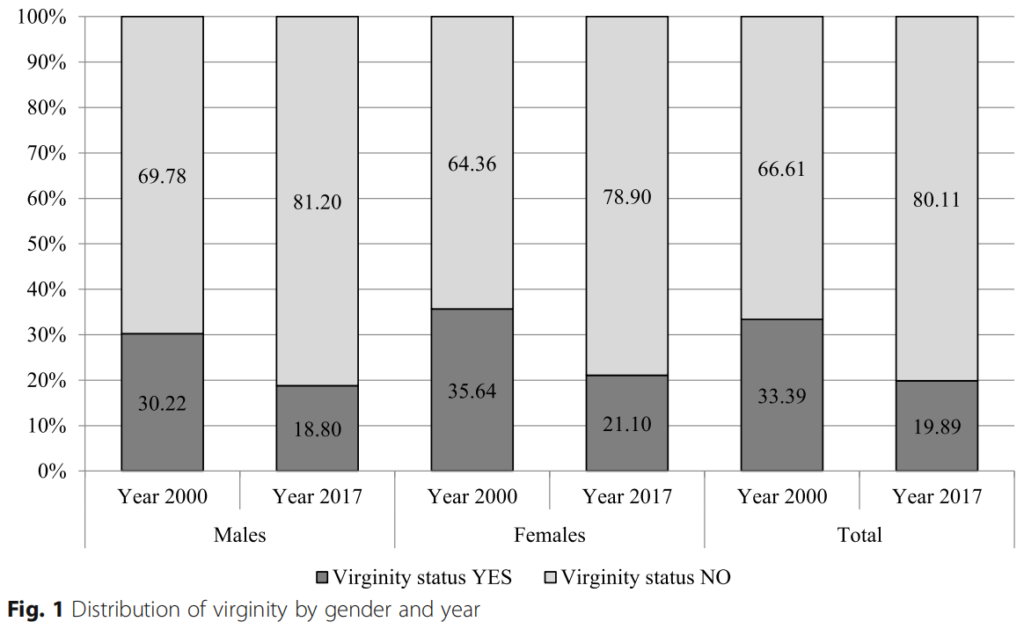
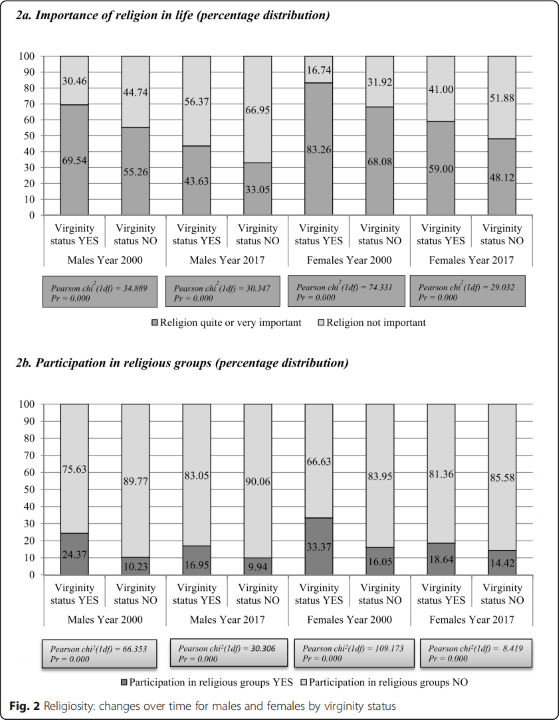
A large reason why is likely the waning of the importance of religion in people’s lives:
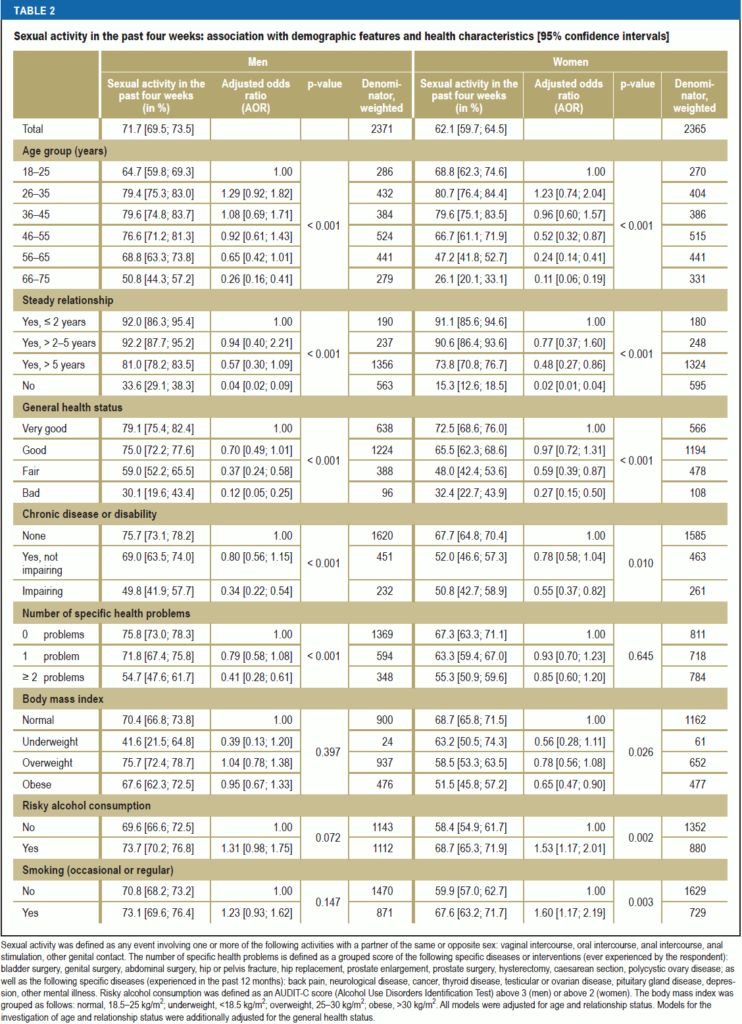
The following data is from The German Health and Sexuality Survey, carried out in 2018/2019. As it was apparently the first of its kind, we have no earlier point of comparison. However, we can check to see if the gender gap seen in the 2018 GSS is present.
The percentage of 18-25 men who reported having no sexual activity in the past four weeks was 35.3%. Of 26-35 men, 20.6%. Of 18-25 women, 31.2%, and 26-35 women, 20.3%. So there was a small 4% gap among the youngest cohort, but it wasn’t statistically significant, and such a gap could easily be explained by women dating outside of the age bracket or even a general gender imbalance in the young population anyway.
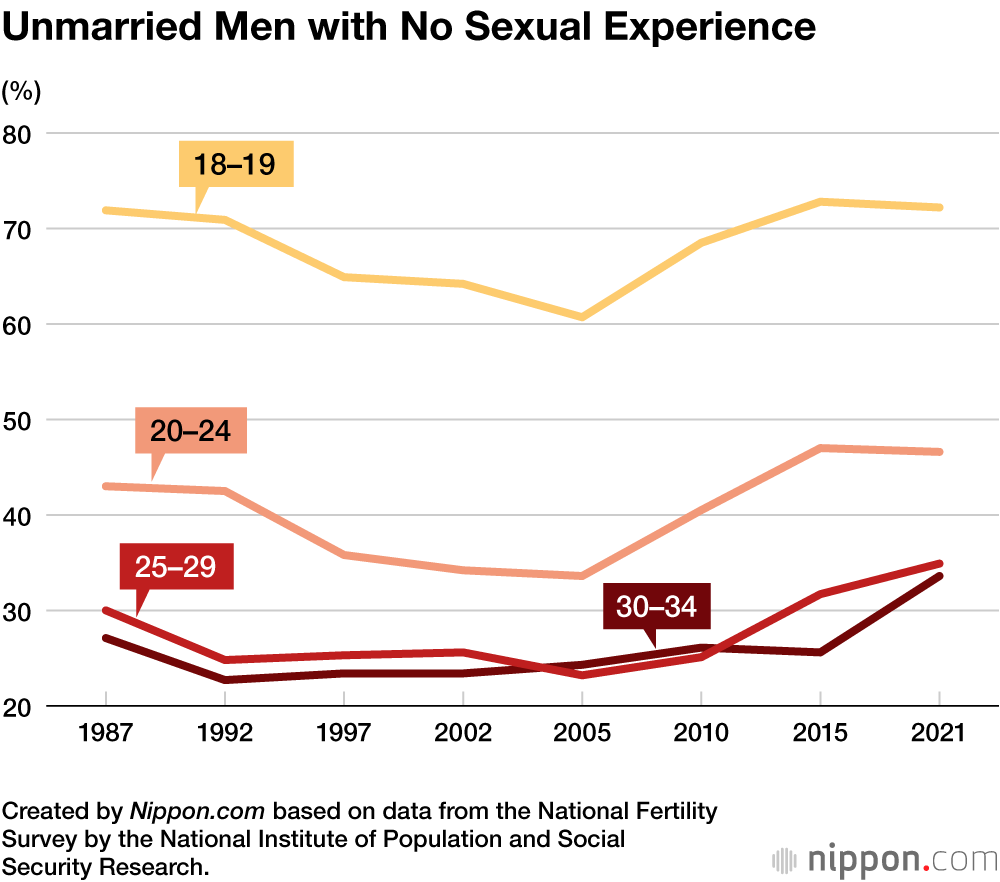
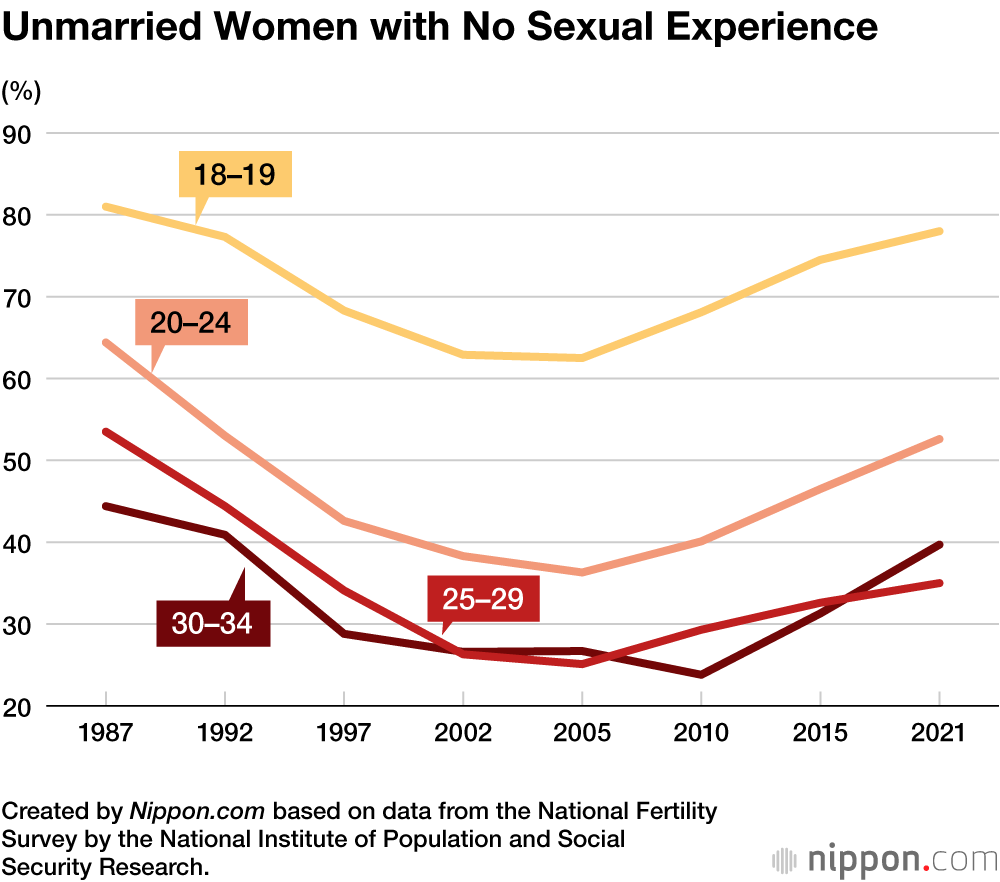
Japan is of course famous for its ‘mating crisis’, and is seen by many as a canary in the coal mine.
According to the National Fertility Survey by the National Institute of Population and Social Security Research, at least when it comes to sexual experience, this trend began in 2005.
For never married men and women (and the never married part is important, a lot of media outlets generalize these figures to men and women broadly while clearly including married people will reduce the overall sexlessness rate) we see similar proportional increases in sexlessness of about 35% across the age groups, though these haven’t risen to unprecedented levels but about back to what they were apparently at in the late 80s.
Among the youngest generation of men it seems to have flatlined. If there are more never married young people though I guess this could still represent an overall increase.
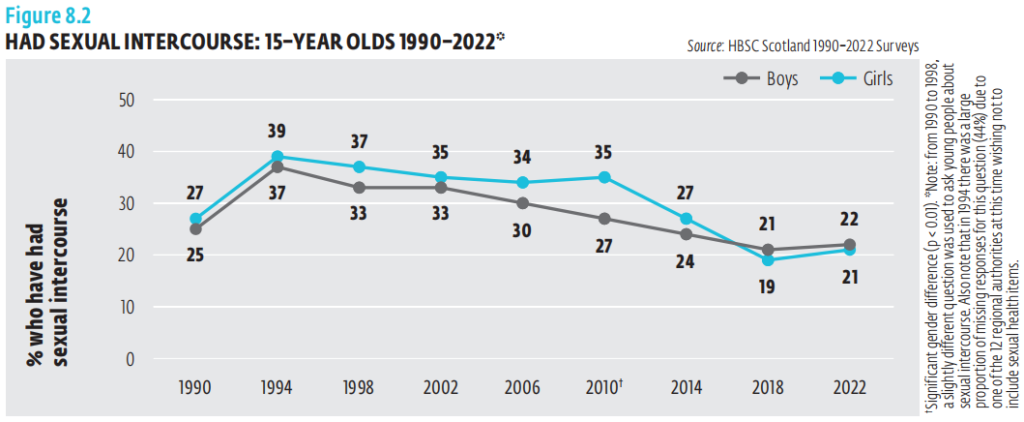
Scotland’s Health Behaviour in School-aged Children study found a significant increase in virginity among 15 year olds from the apparent peak of non-virginity in 1994 to 2022.
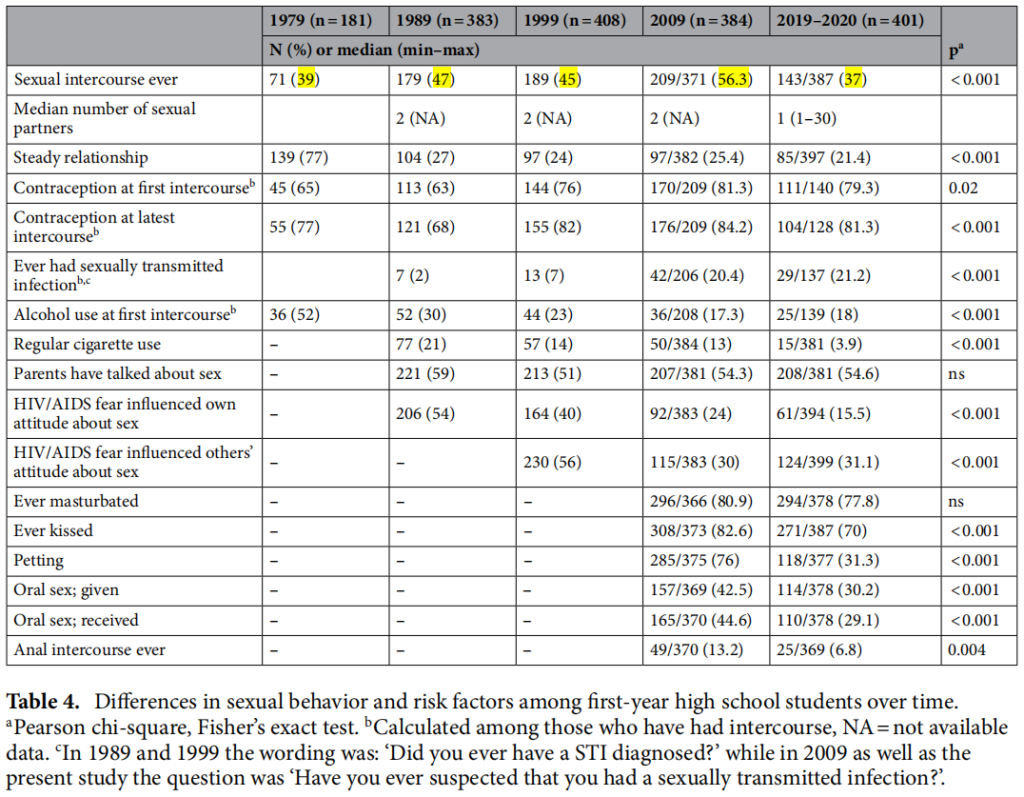
Borneskog et al. (2021), found that sexual experience had dropped among Swedish high school students between 1989 to 2020, though not to unprecedented levels but apparently about what it was at in 1979. The proportion who’d had sex remained unaffected by gender.
So while this is by no means a comprehensive analysis, and we can find some mixed results perhaps due to cultural differences, it seems like there’s probably a general trend towards less sex among younger generations. We might have to wait for more research to come in before getting a fuller picture.
Common Criticisms
The people that can’t get enough of the 2018 GSS data also happen to simultaneously be its strongest critics. This is because it’s not as extreme as they’d like it to be. It doesn’t show 90% of men being sexless while all the women are hooking up with the top 10% of men. The criticisms of course become a lot fiercer when confronted with the more recent survey data.
The most common criticism is that the real rate of sexlessness is significantly higher than the one portrayed in the data, while the female rate is lower. This is because ‘men lie up and women lie down’, and this is because men are shamed for their sexual inexperience, while women are shamed for their promiscuity (although in the same breath they’ll say that women are celebrated for being sluts).
While I could at least feasibly see this affecting the male rate, it’s hard to see how it would affect the female one. After all, it’s binary. Either you had sex or you didn’t. While I could see women reporting a lower partner count, it only has to be at least one. Unless they were unmarried Amish women, it doesn’t seem likely that they’d feel socially pressured into reporting no sex partners whatsoever.
There is also the bogus pipeline experiment, which shows that responses to sexual questions given in an anonymous condition aren’t significantly different from those given under a (fake) lie detector condition.
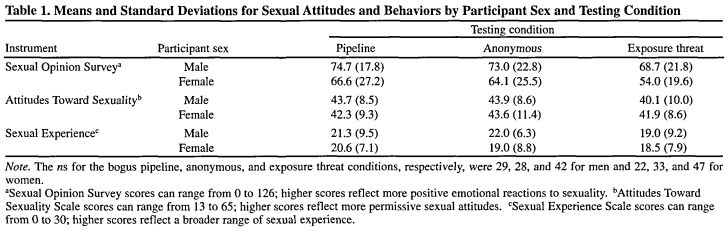
I’d suggest reading this article for a more thorough rundown of the relevant research.
It’s also hard to see how this relates to changes across surveys. When social desirability bias is invoked as a response to the more recent GSS data for instance, you’re saying that a large portion of men suddenly felt like pretending to have had sex when they didn’t in 2018, which doesn’t seem likely.
Another is that many of the men who’ve had sex in the past year may have only had it as little as once, so it understates the severity of the situation.
We can see from this graph seen however that while it appears that the amount reporting monthly sex has risen while the amount reporting weekly sex has fallen, the amount of 18-30 heterosexual men reporting having had sex only once or twice in the past year remains only about 10%.
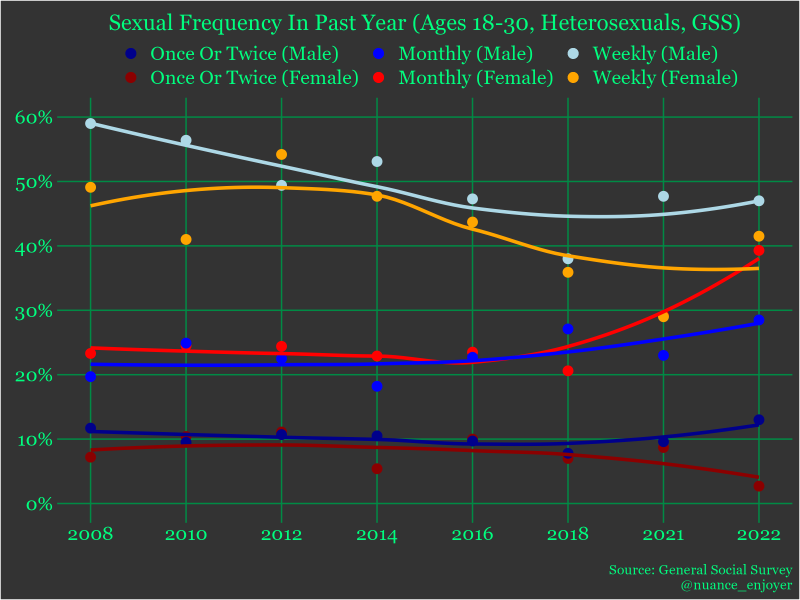
Is this reduction in frequency due to lowering testosterone levels? Porn addiction? More school or work related stress? It’s anybody’s guess. Still, the median 18-30 heterosexual is still having sex 2-3 times a month. Edit: among those who had sex in the past year it’s once a week. Maybe not ideal for everyone, but what is in life.
Another is that many of the men may have had to resort to escorts. I’ve seen this used to try and explain why the male sexlessness rate dropped as well, men are increasingly turning to them.
Here are the percentages of those who said they had paid (or been paid for) sex in the past year. These may be slight underestimates as some selected ‘don’t know/no answer’.
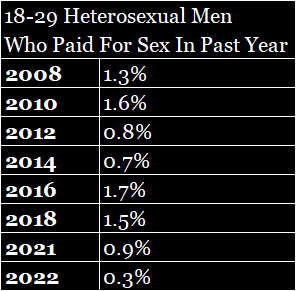
So 1-2% of heterosexual 18-29s visit escorts (assuming they aren’t male prostitutes themselves), and this doesn’t seem to have risen with time. It’s also worth mentioning that many of the men who report visiting escorts in the past year also report having had sex with a regular partner in the past year, so it’s not the case that all men who visit escorts do it out of absolute necessity.
The Femcel Question
A large focus of the sexlessness discourse has been on the apparent gendered nature of it. The sexlessness rate for men is generally thought to be rising more for men than women, leading to increasing ‘sexual inequality’.
It seems like this trend may not be gendered after all however, as the 2021 and 2022 GSS surveys showed a reversal of the gender gap, and the more reliable NSFG didn’t show it in the 2017-19 survey. Even if it was though, it could also be due to women increasingly choosing to date older men.
Many really do not like this, as they view women’s sexual access as an unfair privilege that they enjoy (they don’t consider that women may not enjoy casual sex in the same way that men do), and to suggest there’s no sex gap is to deny this privilege, or to say that they are ‘incels’ too.
However, to say that the sexlessness trend isn’t gendered isn’t to say that it’s equally attributable to choice or a lack thereof on both sides.
If ‘hypergamy’ does play a role, it’d be more in the sense of women increasingly considering men to fall short of their standards and therefore choosing to ‘go their own way’ (or they just aren’t interested in men in general). The ‘chadopolization’ hypothesis however doesn’t seem tenable in light of this and other (STD rates etc.) data. It could also represent signs of a general social breakdown affecting relationship formation across the board.
What Is The Big Appeal?
There has to be a reason why these graphs blew up as much as they did, and why there is so much resistance to new information. I believe that most incels really want to see the line keep going up because it helps them feel less bad about their own situation. They want to feel like they’re not alone in their suffering, and they would rather feel like they’re merely a symptom of a rapidly spreading social epidemic than that it’s a more personal problem.
Then there’s the simple fact that it means that there’s more opportunities to recruit more people into their movement, and there’s more reason for people to take it more seriously as a social justice cause.
What about people outside their movement though (or adjacent movements like MRAs), or who aren’t even incel in the lowercase sense? What makes this narrative so compelling to them?
Part of it may be that ‘male loneliness’ is the latest social justice cause that people are virtue signaling over. Even many feminists seem to be on board with it, as maybe they realized that they’ve ‘won’ in a sense, and perhaps even feel guilt or at least want to appear like they do for what many perceive as an over-correction, leading to men being demonized and disenfranchised. “The men are not alright, we have failed men” they will patronizingly lament. It has become quite a profitable grievance industry. On the flip side, some may even revel in it as they want to see men suffer.
The mass killings that have been associated with the incel movement generated a lot of media and public attention around the subject. Some may find the looming danger of the ‘incel uprising’ a captivating possibility.
There’s probably a comedic aspect to it. Male sexual inexperience has often been the subject of ridicule. Entire movies have been made around it.
Then of course there’s the fact that there probably is a trend here to some extent, and it may affect men more than women due to differences in sex drives and because men’s self-esteem is more closely connected to sex.
Conclusion
Ultimately with issues like this, the more nuanced picture always gets lost in the alarmist noise. There’s a reason why everyone’s seen the 2018 GSS graph but almost none of them have seen the subsequent surveys, let alone another source like the NSFG. This just doesn’t emotionally appeal to people in the same way. They don’t want the truth first and foremost, they want to see line go up, either because it’s a satisfying cope (“EVERYONE is an incel now, not just me!”) or it’s just more exciting than “things haven’t really changed that much”. Negativity bias is a psychological phenomenon which the media is all too ready to exploit, and social media algorithms only exacerbate this.
Still, there’s probably something there at least. It’s just not as huge as people want it to be, and we’ll have to see if it continues or if it really did peak around 2018 for whatever reason.
Of course none of this is to take away from anyone’s individual struggles, but we should be careful about projecting them onto society as a whole.
To summarize the main points:
- The sexlessness epidemic has likely been exaggerated as the GSS data appears to have began with an underestimate and ended with an overestimate judging by the subsequent survey results and more reliable survey data
- The trend which does exist doesn’t appear to be gendered but is affecting both genders equally, even if the implications aren’t the same for each gender
- About half of the sexless men may be voluntarily so
- Only a small minority had sex only once or twice in the past year, escort visitation remains low, self-reported sexual behaviour is probably quite accurate
- More Recent Survey Data
- What Happened?
- The NSFG
- The Virginity Graph
- Volcels
- Other Countries
- Common Criticisms
- The Femcel Question
- What Is The Big Appeal?
- Conclusion
References
Ingraham, C. (2019). The share of Americans not having sex has reached a record high. Washington Post. https://www.washingtonpost.com/business/2019/03/29/share-americans-not-having-sex-has-reached-record-high/
Stone, L. (2021). More Faith, Less Sex: Why Are So Many Unmarried Young Adults Not Having Sex?. Institute for Family Studies. https://ifstudies.org/blog/more-faith-less-sex-why-are-so-many-unmarried-young-adults-not-having-sex
Wolfinger, N. H. (2023). Is the Sex Recession Over?. Institute for Family Studies. https://ifstudies.org/blog/is-the-sex-recession-over
Wang, K. (2023). DP sex survey finds Engineering students are most sexually active. The Daily Pennsylvanian. https://www.thedp.com/article/2023/02/penn-sex-survey-students-gender-sexuality-experience-preference
Centers for Disease Control and Prevention (2023). Youth Risk Behavior Survey, 2011-2021: Data Summary and Report. https://www.cdc.gov/healthyyouth/data/yrbs/pdf/YRBS_Data-Summary-Trends_Report2023_508.pdf.
Mercer, C. H., Tanton, C., Prah, P., Erens, B., Sonnenberg, P., Clifton, S., Macdowall, W., Lewis, R., Field, N., Datta, J., Copas, A. J., Phelps, A., Wellings, K., & Johnson, A. M. (2013). Changes in sexual attitudes and lifestyles in Britain through the life course and over time: findings from the National Surveys of Sexual Attitudes and Lifestyles (Natsal). Lancet (London, England), 382(9907), 1781–1794. https://doi.org/10.1016/S0140-6736(13)62035-8
Mercer, C. H., Clifton, S., Riddell, J., Tanton, C., Freeman, L., Copas, A. J., Dema, E., Bosó Pérez, R., Gibbs, J., Macdowall, W., Menezes, D., Ridge, M. C., Bonell, C., Sonnenberg, P., Field, N., & Mitchell, K. R. (2022). Impacts of COVID-19 on sexual behaviour in Britain: findings from a large, quasi-representative survey (Natsal-COVID). Sexually transmitted infections, 98(7), 469–477. https://doi.org/10.1136/sextrans-2021-055210
Stranges, M., & Vignoli, D. (2020). “Like a virgin”. Correlates of virginity among Italian university students. Genus, 76(1). https://doi.org/10.1186/s41118-020-00082-7
Dekker, A., Matthiesen, S., Cerwenka, S., Otten, M., & Briken, P. (2020). Health, sexual activity, and sexual satisfaction. Deutsches Arzteblatt International. https://doi.org/10.3238/arztebl.2020.0645
Nippon (2022). Growing Indifference to Relationships and Sex in Japan. https://www.nippon.com/en/japan-data/h01440/
Inchley, J., Mabelis, J., Brown, J., Willis, M., Currie, D. (2023) Health Behaviour in School-aged Children (HBSC) 2022 Survey in Scotland: National Report. MRC/CSO Social and Public Health Sciences Unit, University of Glasgow.
Borneskog, C., Häggström‐Nordin, E., Stenhammar, C., Tydén, T., & Iliadis, S. I. (2021). Changes in sexual behavior among high-school students over a 40-year period. Scientific Reports, 11(1). https://doi.org/10.1038/s41598-021-93410-6
Alexander, M. G., & Fisher, T. D. (2003). Truth and consequences: Using the bogus pipeline to examine sex differences in self‐reported sexuality. Journal of Sex Research, 40(1), 27–35. https://doi.org/10.1080/00224490309552164
Related Posts

No, Most People Are Not Meeting Through Online Dating
Why The 80/20 Rule Is Only Half True
You say these graphs may be the “most famous in history”. That’s a strong statement. If people are sharing these graphs and discussing them so widely because they find them relatable or possibly true – either because of their own experiences or because of others they know – doesn’t that huge phenomenon suggest that the graphs may, in fact, be true?
Самые важные новости модного мира.
Важные новости всемирных подуимов.
Модные дома, бренды, высокая мода.
Лучшее место для модных хайпбистов.
https://fashionsecret.ru
Несомненно актуальные новости моды.
Исчерпывающие эвенты лучших подуимов.
Модные дома, торговые марки, гедонизм.
Интересное место для трендовых людей.
https://worldsfashion.ru/
Очень важные новости моды.
Все новости всемирных подуимов.
Модные дома, торговые марки, высокая мода.
Новое место для модных хайпбистов.
https://fashionvipclub.ru/news/2024-06-19-gruzin-kotoryy-perevernul-mirovuyu-modu-demna-gvasaliya/
Несомненно актуальные события моды.
Актуальные новости мировых подуимов.
Модные дома, лейблы, гедонизм.
Свежее место для стильныех хайпбистов.
https://hypebeasts.ru/
Полностью стильные события индустрии.
Абсолютно все мероприятия известнейших подуимов.
Модные дома, лейблы, haute couture.
Лучшее место для трендовых хайпбистов.
https://luxe-moda.ru/chic/162-loro-piana-lyubimyy-brend-politikov-i-biznesmenov/
Очень трендовые события модного мира.
Абсолютно все новости известнейших подуимов.
Модные дома, торговые марки, гедонизм.
Новое место для модных хайпбистов.
https://balmain1.ru/balmain/381-kak-otlichit-originalnyy-balmain-ot-poddelki/