What Explains The Young Singleness Gender Gap?
Slightly updated article on this on my other blog: https://nuancepill.substack.com/p/is-there-a-single-young-male-crisis
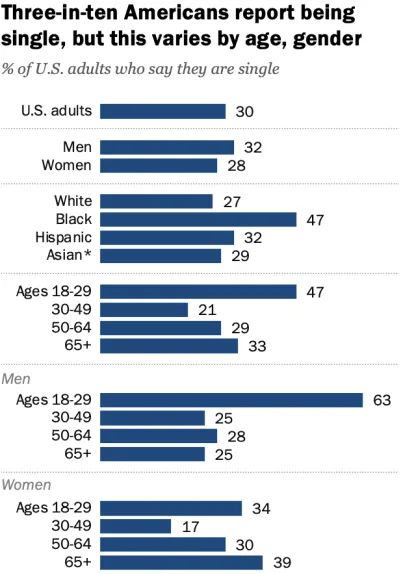
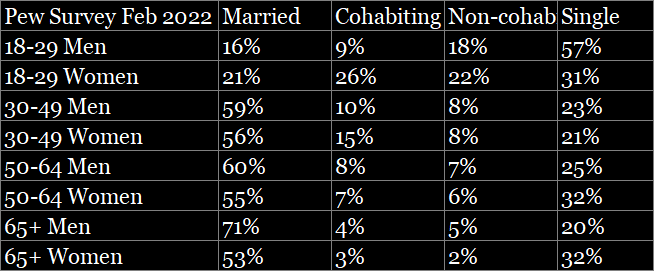
Earlier this year, the results of a Pew research survey were released:
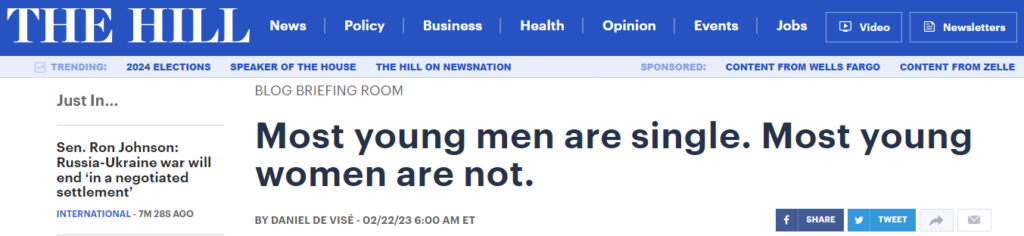
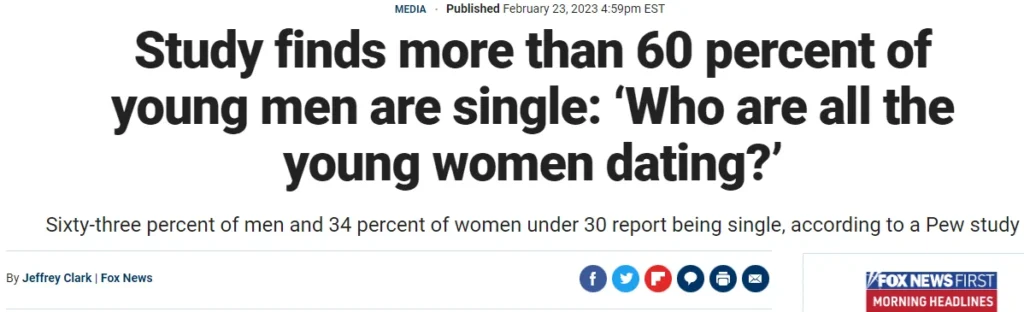
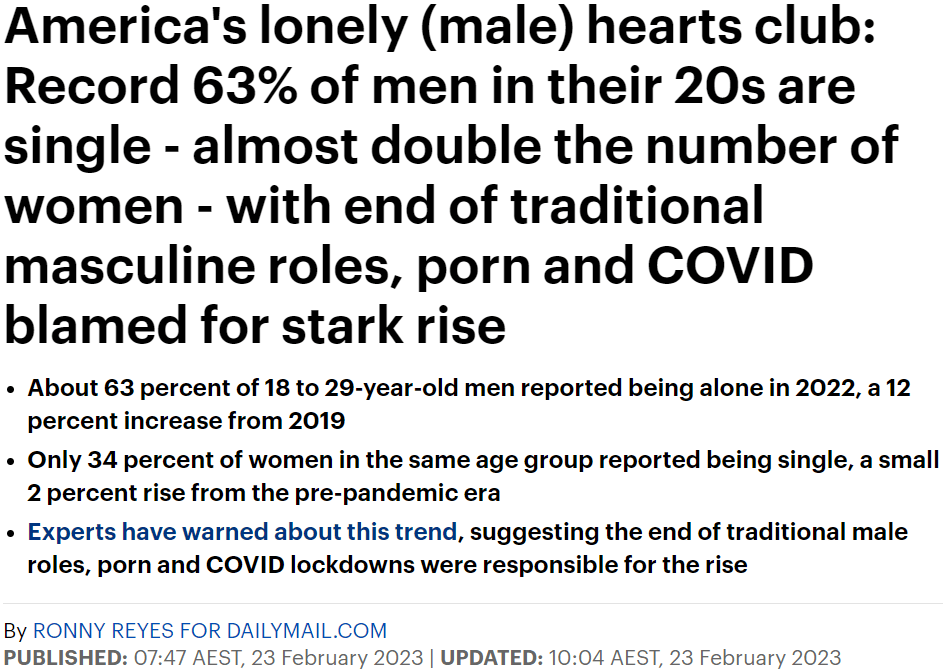
Which sent shockwaves through the media:
How could 63% of 18-29 men be single while only 34% of 18-29 women were? After all, there is one person of each gender in each (heterosexual) relationship isn’t there?
Everyone scrambled for explanations for this puzzling discrepancy. Numerous ones were advanced, from women turning to sugar daddies, to differences in how men and women perceive being in a committed relationship (i.e. ‘situationships’), women going lesbian and foregoing men, and of course the classic ‘chad harems’. It has predictably become a new addition to the black pill repertoire.
While it is the case that there is a male-skewed sex ratio in this age bracket, it can obviously only explain a small portion of the gap. According to data from the US Census Bureau, 18-29 men make up 8.22% and 18-29 women 7.85% of the US population as of 2022. This would translate to a ratio of 104.7:100. If from a population of 104.7 and 100, 66 men and women were in a relationship, this would translate to 37% of men and 34% of women being single. So we have managed to explain 3% of the total 29% gap, which still leaves a good 26% remaining.
Do age gaps explain it?
So what about age gaps then? Women preferring and dating men older than them is a consistent cross-cultural trend, so maybe this explains why there are more single men in the 18-29 age bracket – many women within it are dating men 30 and up.
The average age gap in relationships among 18-29s seems to be about 2-3 years:
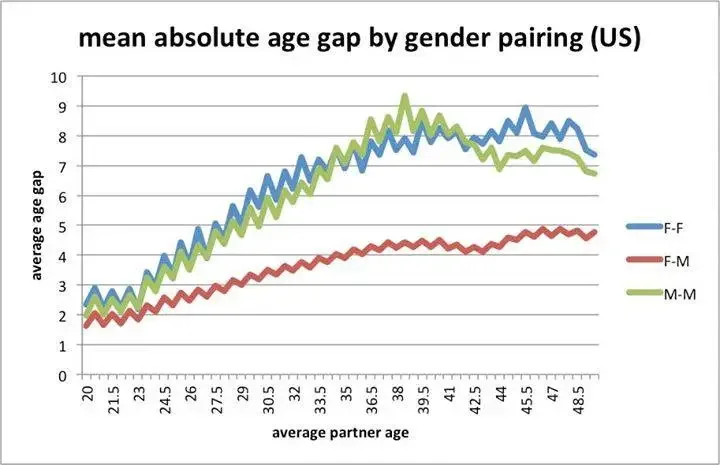
Just on its surface, this average gap doesn’t seem like it can account for a significant portion of the singleness discrepancy. Of course some gaps will be wider than the average, but likely not enough to have a significant impact.
Something worth considering though is that most of the singles are clustered in the younger half of the age bracket. Small differences among the oldest respondents (who are most likely to be in relationships) may have a significant impact on the whole.
From this 2022 American Census Bureau data, of 63,191 opposite-sex married couples, 4% of men were 25-29, while 5.5% of women were. 1.1% of men and 1.7% of women were under 25, so about 0.6% of that 4% was presumably marrying women from this age group as well.
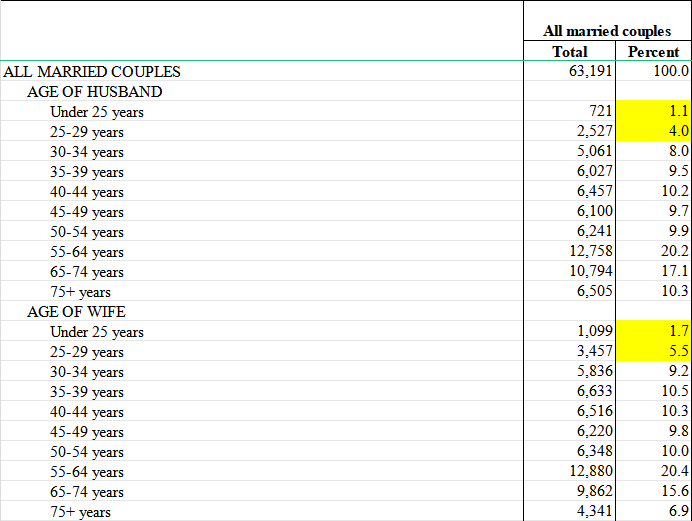
So roughly 40% more married women were in the 25-29 age bracket than men, and since polygamy is illegal in the US we can be safe in assuming in this case that there is one man partnered to every woman.
If we assume this ratio carries over to other relationship types (though marriage is likely to be more skewed towards the older side of the bracket than other relationship types), and say that 55% of 25-29 men are in relationships, 77% of 25-29 women will be. Let’s say 15% of the men are dating women below 25 (leaving close to half of the 25-29 women dating men 30 and up), this will represent about 10% of 18-24 women. Let’s say another 25% of women are in relationships with 18-24 men (and ignore whatever small percentage of 18-24 men are dating below 18 women).
After weighting the rates among 25-29s down to reflect the smaller pool of people it represents (5 ages instead of 7), around 53% of women and 38% of 18-29 men would be in relationships, for a gap of 15%. We’re making progress, but even making some generous assumptions, and taking into account the gender ratio in the young population we’re gunna be short of 20%, let alone 29%.
There’s also the fact that even in the 30-49 category there were apparently 8% more single men than women. We wouldn’t necessarily need there to be more single women than men in this cohort, as some portion women in it will be being pulled from the older cohorts as well, but this appears to leave little room for the large surplus of non-single 18-29 women.
Other explanations?
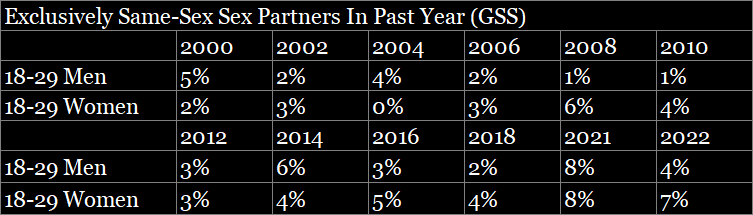
So what about the bisexuals/lesbians? It’s difficult to find data on same-sex relationships. Sex of sex partners in the past year may be a decent proxy, especially since a good majority of sex occurs within relationships. Looking at data from the General Social Survey, we find that slightly more 18-29 women than men tend to exclusively have sex with same-sex partners than men. It looks like the rate may be rising somewhat, and is somewhere between 4-8% in recent years for women.
It may also be the case that if women are typically more relationship oriented than men, same-sex female couples will be more common for them. US Census Bureau data supports this idea to an extent, as slightly more cohabiting same-sex couples are women.
Realistically though, these facts together are unlikely to explain much of the gap.
What about ‘situationships’? They seem to be more common than they used to be, but this explanation would require a substantially higher number of women than men to feel comfortable describing their situation as a ‘committed relationship’ (unless you’re going with the chad harem narrative). I don’t have a firm basis for proposing this however. One might suggest that women get emotionally attached faster than men do, but a study actually showed that men may fall in love (and express this) earlier in a relationship than women.
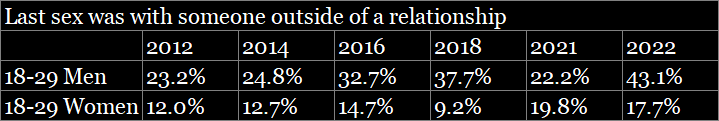
On the other hand, the GSS does seem to offer some tentative evidence that the gap in young men than women reporting their last sex act being outside of a relationship is widening, but it’s too soon to tell due to the wide margins of error.
It seems like we’ve hit a bit of a brick wall. We still don’t have a satisfying explanation or even set of explanations to explain this bizarre 29% gap in singleness. There’s also the problem that the singleness rate apparently rose 12% from the 2019 Pew survey, compared to 3% for women. How do we explain why men’s rose so disproportionately?
What do other data sources say?
Another source is the American Perspectives Survey, which like Pew employs a nationally representative panel. The overall sample size of 5,055 is comparable when you account for the oversample of LGB in the Pew sample.
What we find is that contrary to the Pew findings, the singleness rate for 18-29 men dropped, from 59% in 2020 to 57% in 2022. Women’s singleness rate also rose more than it did in the Pew survey, from 38% in 2020 to 45% in 2022.
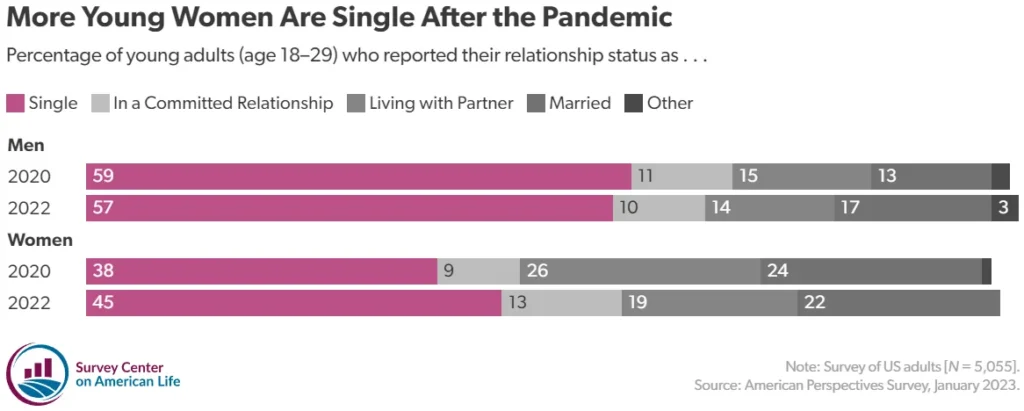
So overall, while the singleness gap widened by 9% across the Pew surveys, it narrowed by 9% across the APS surveys. An exactly opposite ‘trend’.
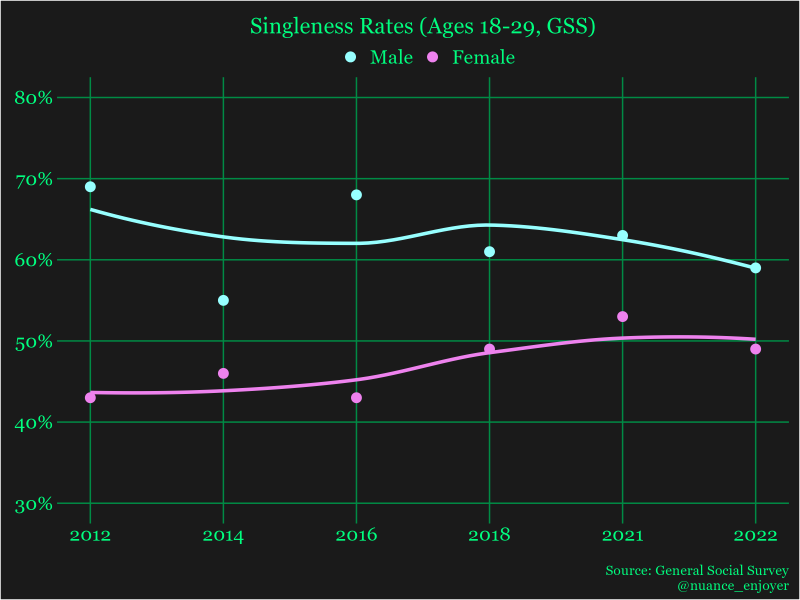
Then we have the good old General Social Survey. The question relating to relationship status is split into two forms and the variables labeled ‘POSSLQ’ and ‘POSSLQY’, which I combined to compute the overall percentage of 18-29 men and women who ‘don’t have a steady partner’.
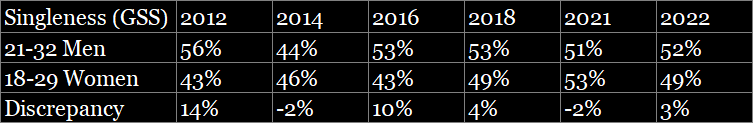
In the 2021 survey, there was a gap of 10.5%, which remained basically unchanged in the 2022 survey. Interestingly, if anything we see a narrowing rather than a widening of the gap over the timespan of 2012-2022. The largest gap was 26% in 2012, with a male singleness rate nearing 70%.
If we combine the sample sizes of 18-29 men and women from 2021 and 2022, we come to an overall sample size of 1,065, which is a bit higher than the Pew sample size in 2022.
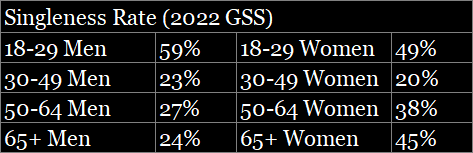
If we increase men’s lower and upper age bound by 3 years, the gaps are considerably minimized, reversing in a couple of cases:
Along with the slightly skewed gender ratio in the younger population it therefore seems reasonable to attribute the gap to age gaps.
If we look at the older age categories in the GSS, we also see a lower age gap among 30-49s, and a higher one among 50+s, allowing for more room for age gaps as an explanation.
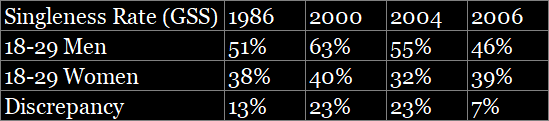
We can also look at the earliest years this question was asked in to observe that neither singleness rates above 50% for 18-29 men or significant gender gaps are anything new.
All in all, what these results tell us is that we shouldn’t just take a single survey’s estimates in any particular year as the be all end all. There appears to be a fair amount of variability depending on the source and year we’re looking at.
What about chad harems though?

It’s time to confront the chiseled-jawed elephant in the room. From the ‘black pill’ POV, all this floundering around is just a feeble cope. The answer is obvious, there’s no need to overcomplicate things. This omnipresent stud must be hoarding an increasing share of the women. It’s not literal polygamy or polyamory, but it’s covert, you see. The gap seen here represents him ‘spinning plates’. He is having sexual relations with numerous women in his ‘rotation’, while they naively assume that he’s committed to them.
Of course you can cherry pick instances of this occurring, but is this really a widespread phenomenon, even when we’re in the age of social media where everything is shared to everyone at all times? Now here’s why I argue this is not a plausible explanation. It’s unfortunate that Pew didn’t break down the types of relationships people were in, as it adds useful context.
Let’s take another gander at those APS results. In 2020, we see that the gap was slightly reversed in the case of general ‘committed relationships’, with 2% more men in one. In the case of marriage and cohabitation however, there were 11% more women in each category.
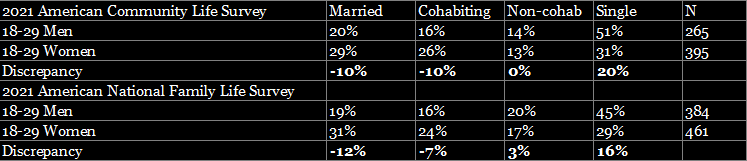
Two other surveys conducted by The Survey Center on American Life found the same pattern.
Here is the breakdown of the GSS results:
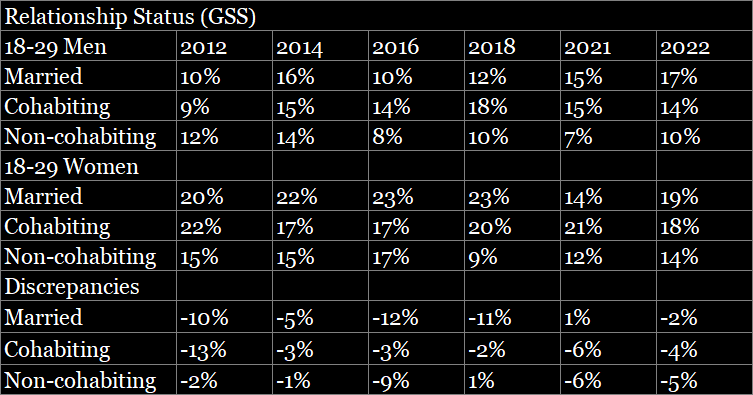
In 2012, 23% of the overall 26% gap resided in the categories of marriage and cohabitation. In 2014, 8% of the overall 9% gap did. In 2016, 16% of the overall 25% gap did. In 2018, all of it (13%) did, while slightly more men were in non-cohabiting relationships. In 2021, 5% of the 10% gap did, and in 2022, 6% of the 10% gap did. So overall, most of the gap in being in a relationship was caused by a gap in being married or cohabiting.
The last Pew survey doesn’t yet seem publicly accessible, but Pew conducted a survey earlier in the same year of 2022 on the topic of economic well-being, which included relationship questions and which employed the same American Trends Panel as the later and 2019 relationships survey. This means there may be a good deal of overlap among the panelists. As far as I can tell they didn’t publish these results anywhere, but the data is available to access and analyze.
What we find is the same pattern, 5% of the overall 26% gap was in marriage, 17% in cohabitation, and the remaining 4% in non-cohabitation.
Update: The latest Pew survey dataset dropped, same story. 71% of the gap was caused by more women reporting being in a cohabiting relationship or marriage.
Could a more overt version of it exist in these other categories though? I’ve already mentioned that polygamous marriages are outlawed in the US. Unless chads are suddenly converting to Mormonism we can rule this one out. How about cohabitation? Is it possible that these women are living in polyamorous chad communes?
This 2023 YouGov survey of 1,000 US adults found that 6% of men and 7% of women reported being in ‘completely non-monogamous’ relationships (which would describe polyamory). The rate among 18-29s would be at most slightly higher than the overall rate of 6%, as 6% of 30-44s and 5% of 45-64s reported being in such a relationship.
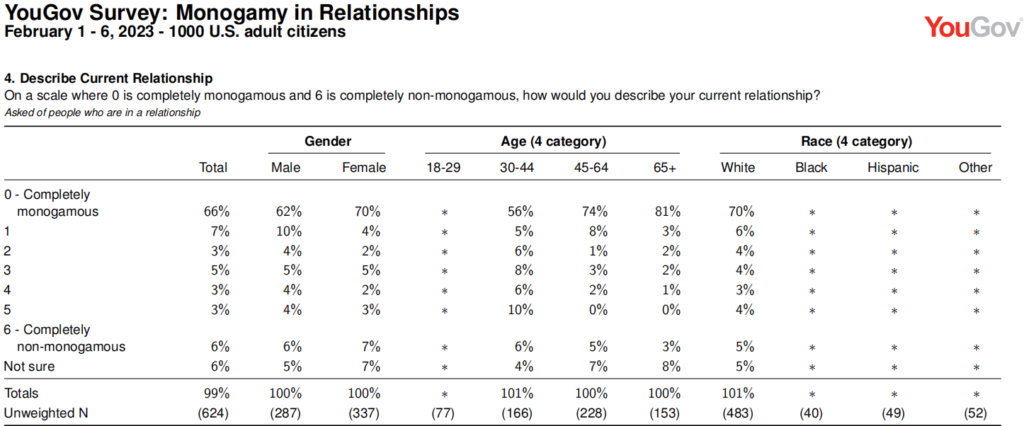
This doesn’t necessarily imply polyamory though, as it can also include open relationships, swinging, cuckoldry, etc. which wouldn’t include more than one persistent cohabiting partner. So we can rule this out as being a significant factor, as the rate is likely less than 5% and there’s also no evidence here for a statistically significant gender difference among those who rate their relationship high in non-monogamy.
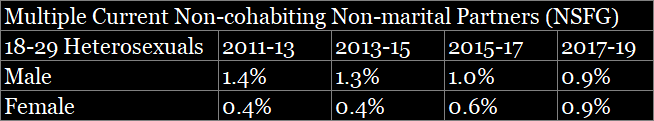
These results from the National Survey of Family Growth may also be of interest. The percentage of 18-29 heterosexual men who report having more than one non-cohabiting and non-marital partner is only about 1%, no more than women in the most recent survey cycle, and the vast majority of these selected two. If anything the rate had fallen since 2011. If you think that these chads tend to report being single, the APS survey found only 1.3% of single young men and women reported currently dating more than one person.
In summary, even if he had Ron Jeremy’s stamina and was a ninja master who manages to juggle a bunch of women without being caught out, there appears to be very little room left for the chadspiracy theory, as it can only ‘realistically’ operate within the vague ‘committed relationship’ category which shows little gender disparity, and even there it’s far from a given.
Are singles ready to mingle?
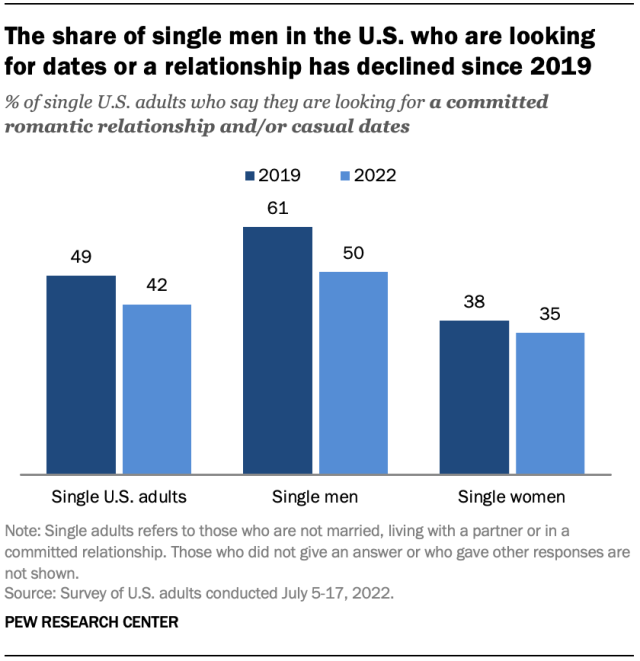
It’s often assumed that all these single men are desperate to find a woman to date, but the same Pew survey found that only 50% of single men were looking to date, apparently down from 61% in 2019.
As I suspected though this is quite heavily skewed by age, especially for women, as according to that dataset from earlier in the year, 38% of single young men weren’t seeking committed relationships, casual dates, or either, and actually less young women weren’t, 31%. If you apply these rates to the percentage who were single, you’d have 22% of young men and 10% of young women who were both single and not looking.
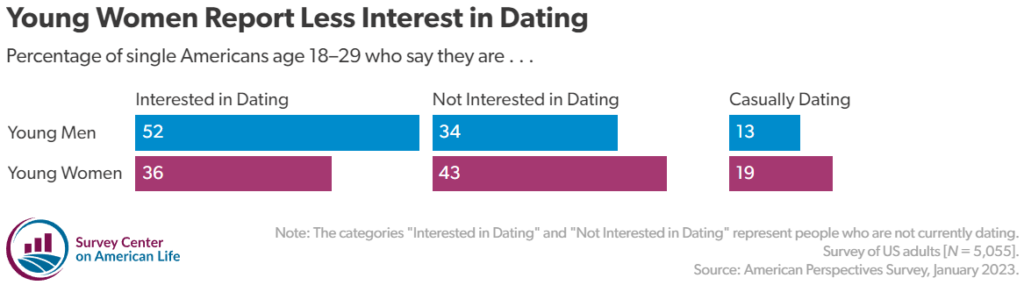
The APS found that 34% of single young men and 43% of single young women weren’t interested in dating, which would translate to 19.4% of both men and women overall. So it’s not completely clear that MGTOWs do outnumber WGTOWs.
To play devil’s advocate it’s of course possible that a lot of these men felt that the dating market was too rigged against them and that they’d be more enthusiastic about dating if it saw some kind of improvements.
The Pew survey also asked why people weren’t interested in dating. 28% of single young men stated that ‘feel no one’s interested’ was a major reason, and 31% said it was a minor one. More men however selected ‘just like being alone’, ‘too busy’, and ‘more important priorities’ (they weren’t mutually exclusive).
Main point summary
- Data sources other than Pew research seem to show smaller gaps in singleness between young men and women.
- The gap seems to be primarily driven by more women than men reporting being in a cohabiting relationship or married, leaving little room for ‘top men’ juggling them as an explanation.
- Overall there is little indication that this gap is widening with time.
- Even going back decades you could have said ‘most young men are single, most young women are not’. There is nothing new about this.
- Many single young men and women report not being interested in dating.
Conclusion
This may not be the most satisfactory way to end, as the Pew gap is left largely unexplained. I’m going to give them the benefit of the doubt and assume that Pew’s methodology is sound, so while I’m aware that it sounds like a cop-out, maybe it was a result of random error which was picked up by the media because crazy results like this are what draws eyeballs, and ‘incels’ seem like their favourite topic lately.
The weight of the evidence seems to suggest the singleness gap may actually be in the range of 10-20% (and not widening), which would remove most of the challenge in explaining it, and what we do know is that since the relationship gaps in these surveys existed primarily in the categories of cohabitation and marriage, there is very little room here for the chadspiracy theory which requires a degree of secrecy. If on the other hand there is a rapidly burgeoning phenomenon of polyamorous cohabitation (along with a stark gender disparity in who’s practicing it) it seems to have somehow managed to go unnoticed. Dating might be getting harder for one reason or another, but we can safely rule out chad harems as the reason why.
References
Gelles-Watnick, R. (2023). “For Valentine’s Day, 5 facts about single Americans”. Pew Research Center. https://www.pewresearch.org/short-reads/2023/02/08/for-valentines-day-5-facts-about-single-americans/
de Visé, D. (2023). “Most young men are single. Most young women are not.”. The Hill. https://thehill.com/blogs/blog-briefing-room/3868557-most-young-men-are-single-most-young-women-are-not/
Clark, J. (2023). “Study finds more than 60 percent of young men are single: ‘Who are all the young women dating?’”. Fox News. https://www.foxnews.com/media/more-than-60-percent-young-men-single-study-finds-young-women-dating
Reyes, J. (2023). “America’s lonely (male) hearts club: Record 63% of men in their 20s are single – almost double the number of women – with end of traditional masculine roles, porn and COVID blamed for stark rise”. Daily Mail. https://www.dailymail.co.uk/news/article-11781425/More-60-men-20s-single-compared-just-30-women.html
Develin, M. (2014). “The Age of Love”. https://www.facebook.com/notes/10158928005158415/
YPulse (2023). “How Many Gen Z and Millennials Have Really Been in a Situationship”. https://www.ypulse.com/article/2023/02/01/how-many-gen-z-and-millennials-have-really-been-in-a-situationship/
Harrison, M. A., & Shortall, J. C. (2011). Women and men in love: Who really feels it and says it first? The Journal of Social Psychology, 151(6), 727–736. https://doi.org/10.1080/00224545.2010.522626
Brown, A. (2020). “Nearly Half of U.S. Adults Say Dating Has Gotten Harder for Most People in the Last 10 Years”. Pew Research Center. https://www.pewresearch.org/social-trends/2020/08/20/nearly-half-of-u-s-adults-say-dating-has-gotten-harder-for-most-people-in-the-last-10-years/
Cox, D. A. (2023). “From Swiping to Sexting: The Enduring Gender Divide in American Dating and Relationships”. The Survey Center on American Life. https://www.americansurveycenter.org/research/from-swiping-to-sexting-the-enduring-gender-divide-in-american-dating-and-relationships/
YouGov (2023). Monogamy in Relationships, February 1-6, 2023. https://docs.cdn.yougov.com/zm6jtysaa5/Monogamy_NonMonogamy_Relationships_Toplines_crosstabs.pdf
Related Posts

No, Most People Are Not Meeting Through Online Dating
Why The 80/20 Rule Is Only Half True
Hey, cool post There is an issue with your website in Internet Explorer; could you please check this? Because of this issue, many people will overlook your excellent article because IE is still the most used browser.
Temp Mail I like the efforts you have put in this, regards for all the great content.
Vitazen Keto I am truly thankful to the owner of this web site who has shared this fantastic piece of writing at at this place.
I was more than happy to find this net-site.I wished to thanks for your time for this wonderful learn!! I undoubtedly enjoying each little bit of it and I’ve you bookmarked to check out new stuff you weblog post.
I’ve been browsing online more than three hours today, yet I never found any interesting article like yours. It is pretty worth enough for me. In my view, if all webmasters and bloggers made good content as you did, the internet will be a lot more useful than ever before.
Having read your blog, you obviously know what you are talking about. I’m sure visiting my page YV6 about Airport Transfer will be worth your time!
What i do not understood is in truth how you are not actually a lot more smartly-liked than you may be now. You are very intelligent. You realize therefore significantly in the case of this topic, produced me individually imagine it from numerous numerous angles. Its like men and women don’t seem to be fascinated until it is one thing to do with Woman gaga! Your own stuffs nice. All the time care for it up!
Good write-up, I am normal visitor of one¦s web site, maintain up the nice operate, and It’s going to be a regular visitor for a long time.